Before Brexit here’s gold and silver last week.
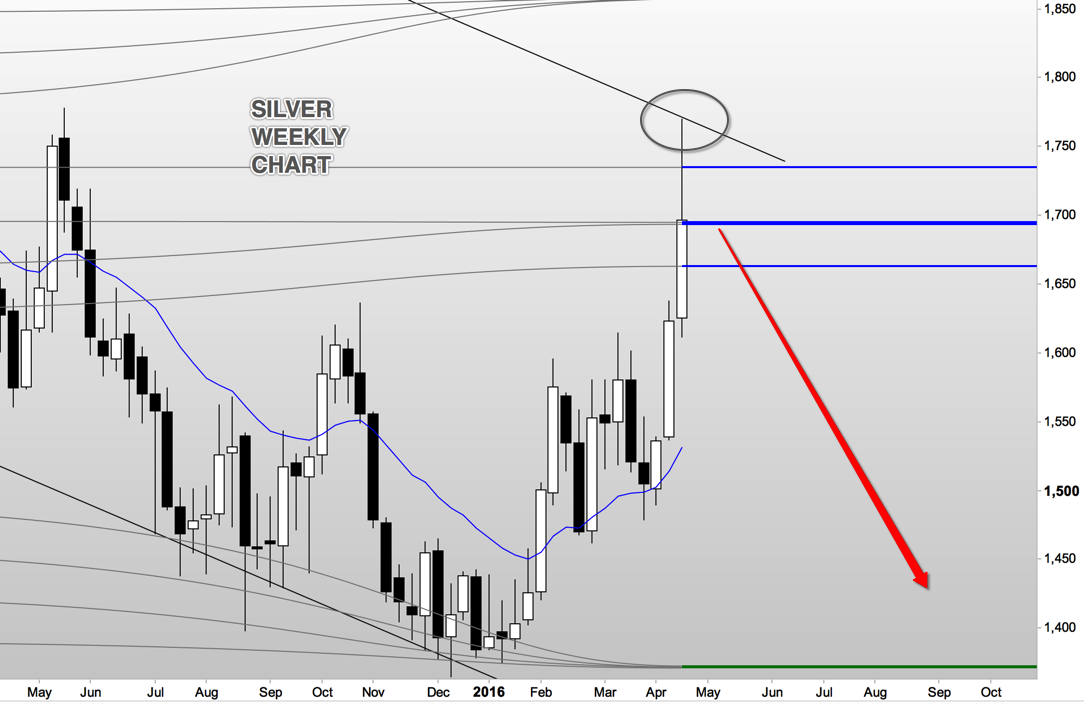
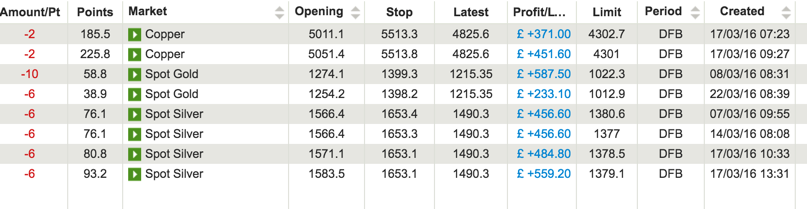
You will recall that we are only looking for short positions in gold and silver. We took profits in both nearly 2-weeks ago and have been looking for an opportunity to take a short since then. Although both gold and silver crept down and tempted everyone to jump on board, this would have been hopefulness.
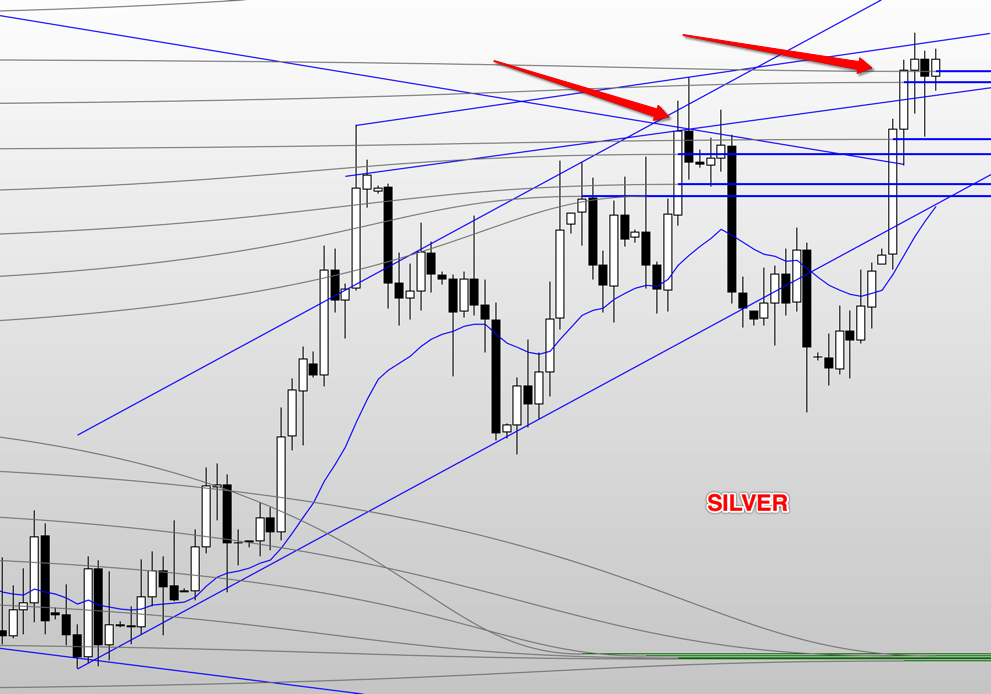
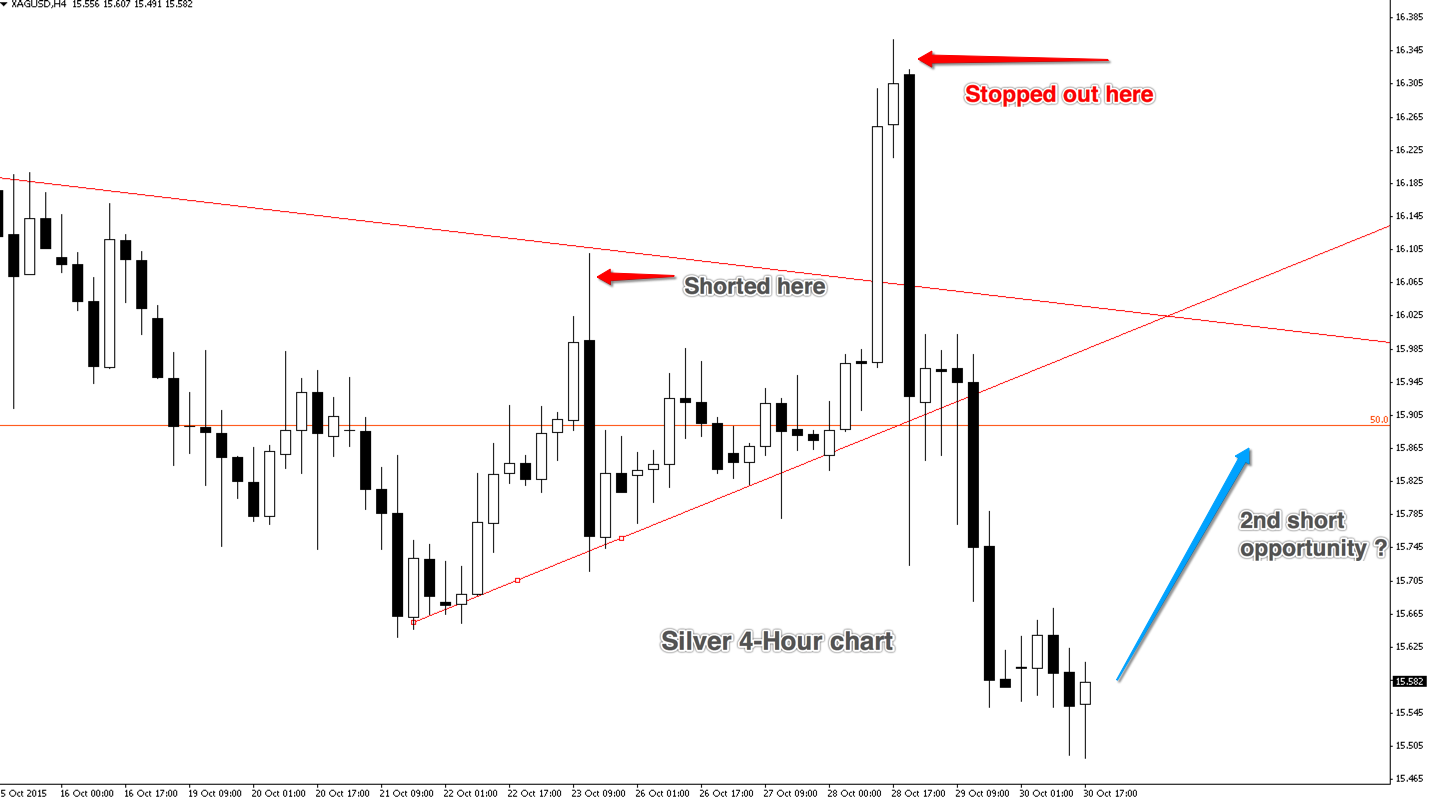
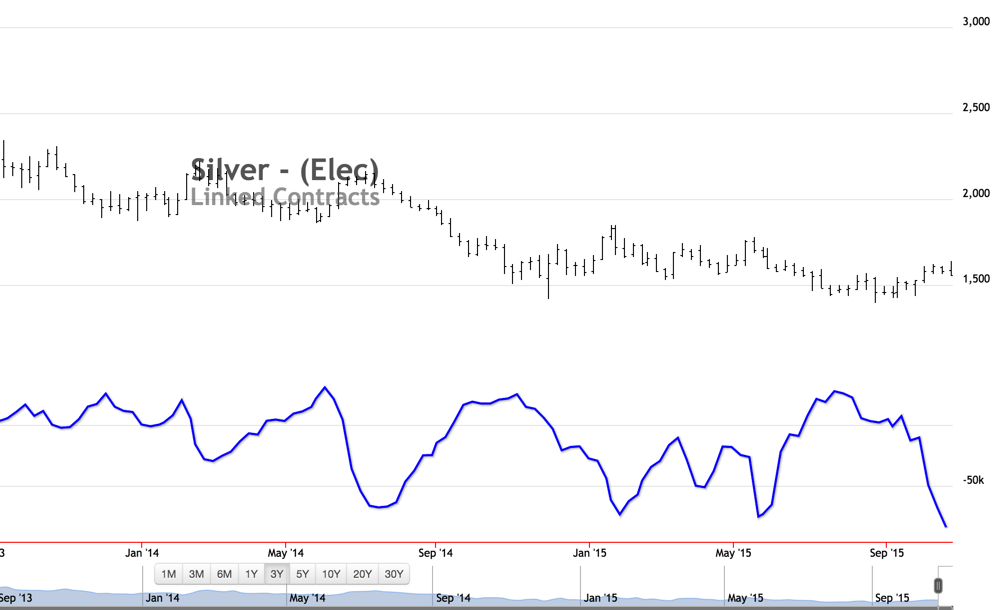
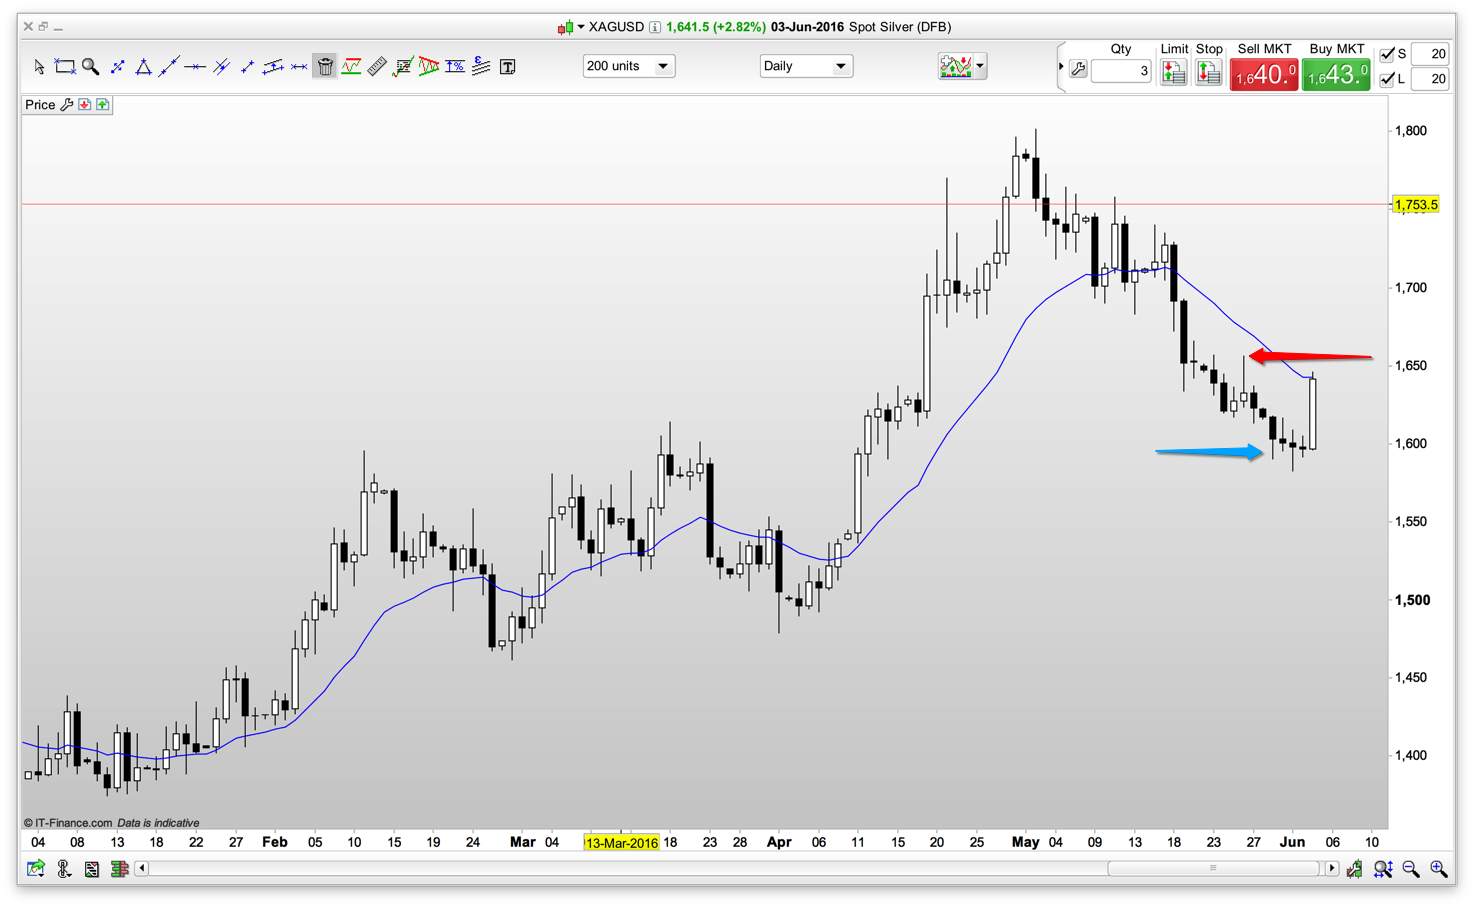
Here’s silver: silver provided a short signal which I missed, and mentioned last week. That would have given us a profitable move down and exit at the blue arrow. However, without a clear ‘short’ context the danger was always the strong pullback, which happened yesterday, and that is why it was correct to not hold our original short too long. The pull back may just be to the moving average, shown by the blue line, or a move to equal the previous high at 1,800; or, significantly higher with a measured move of the previous leg. We will need more information before acting.
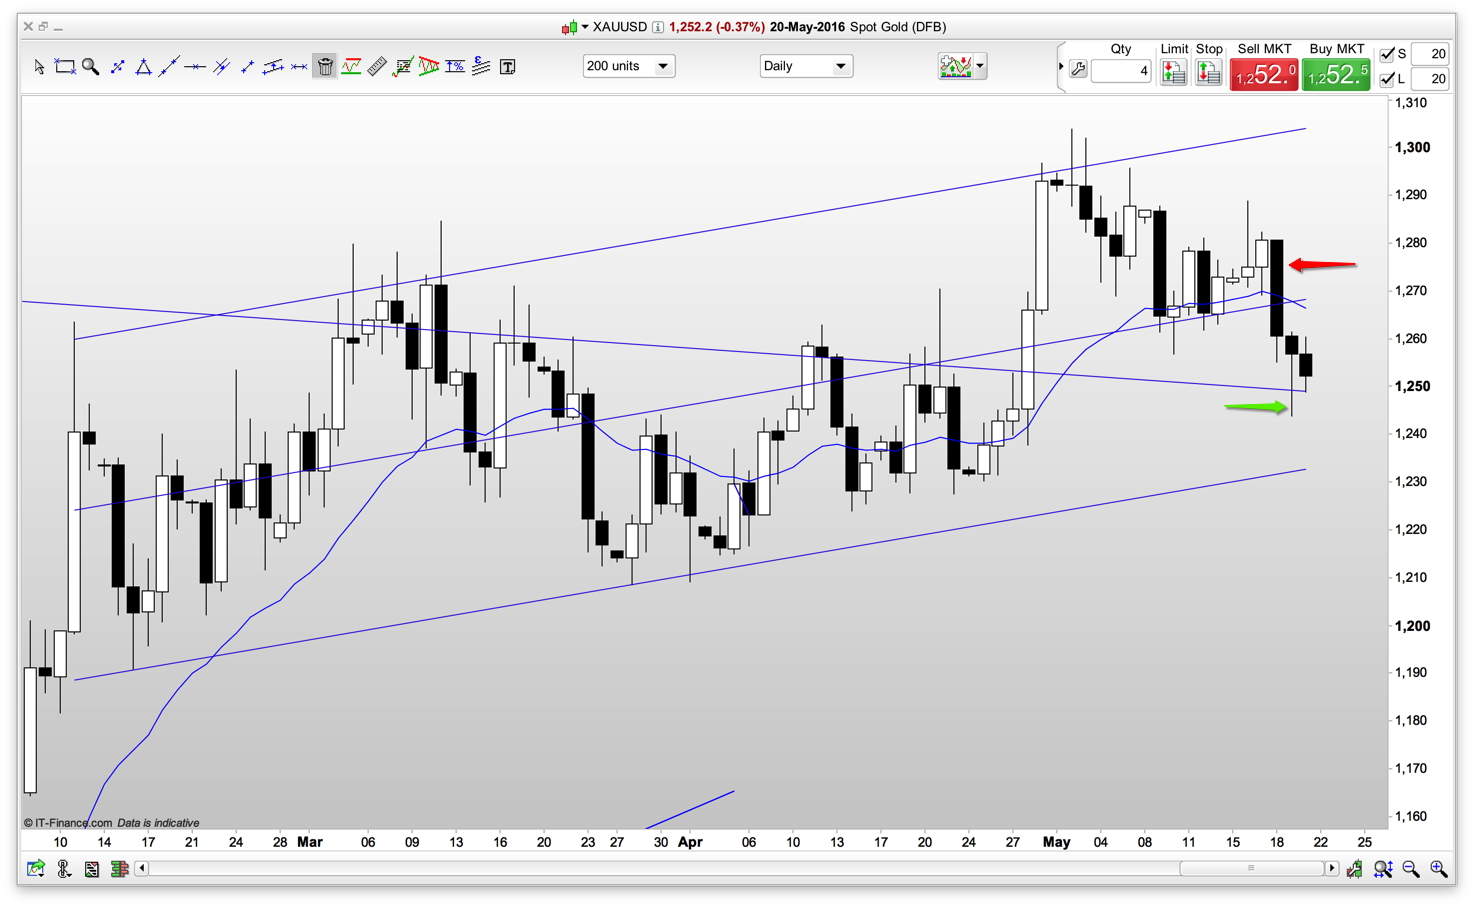
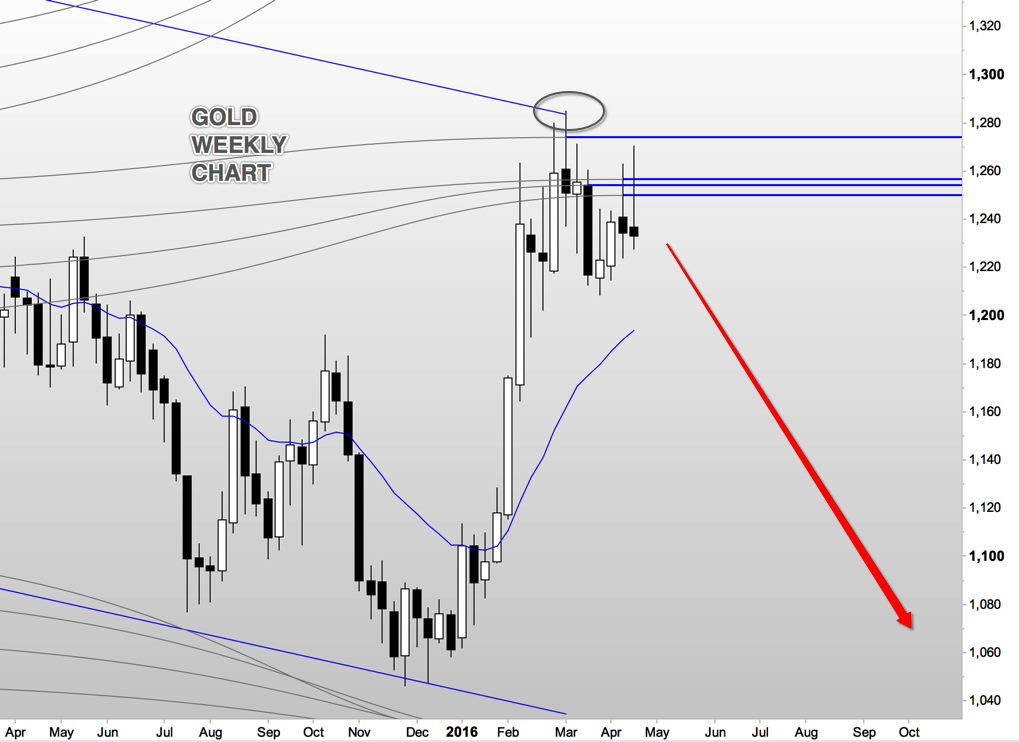
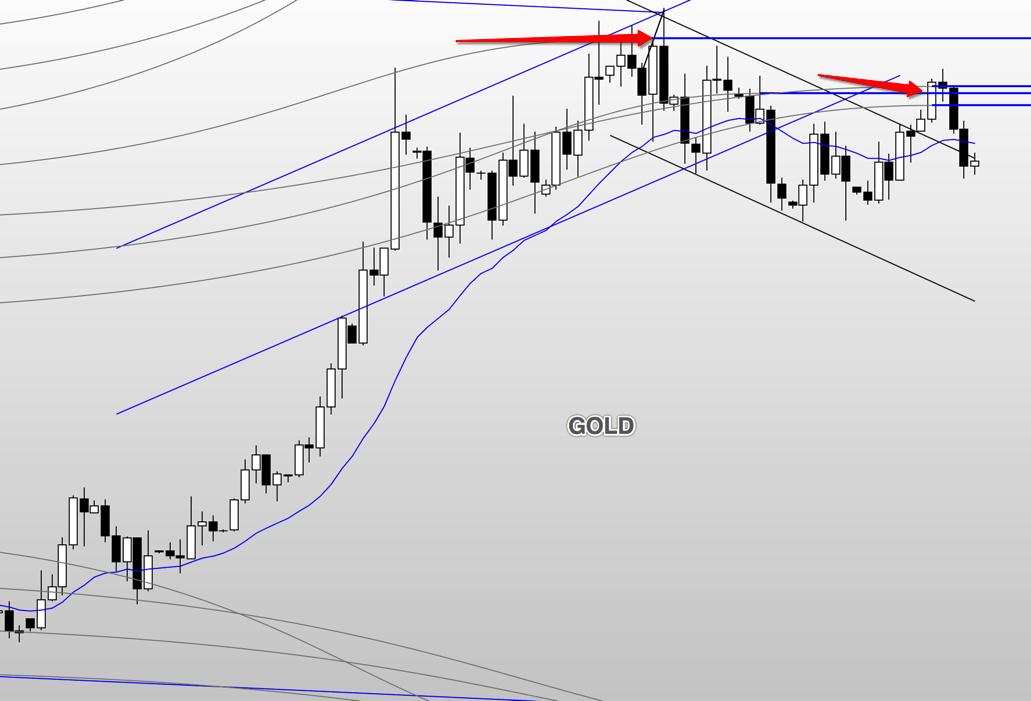
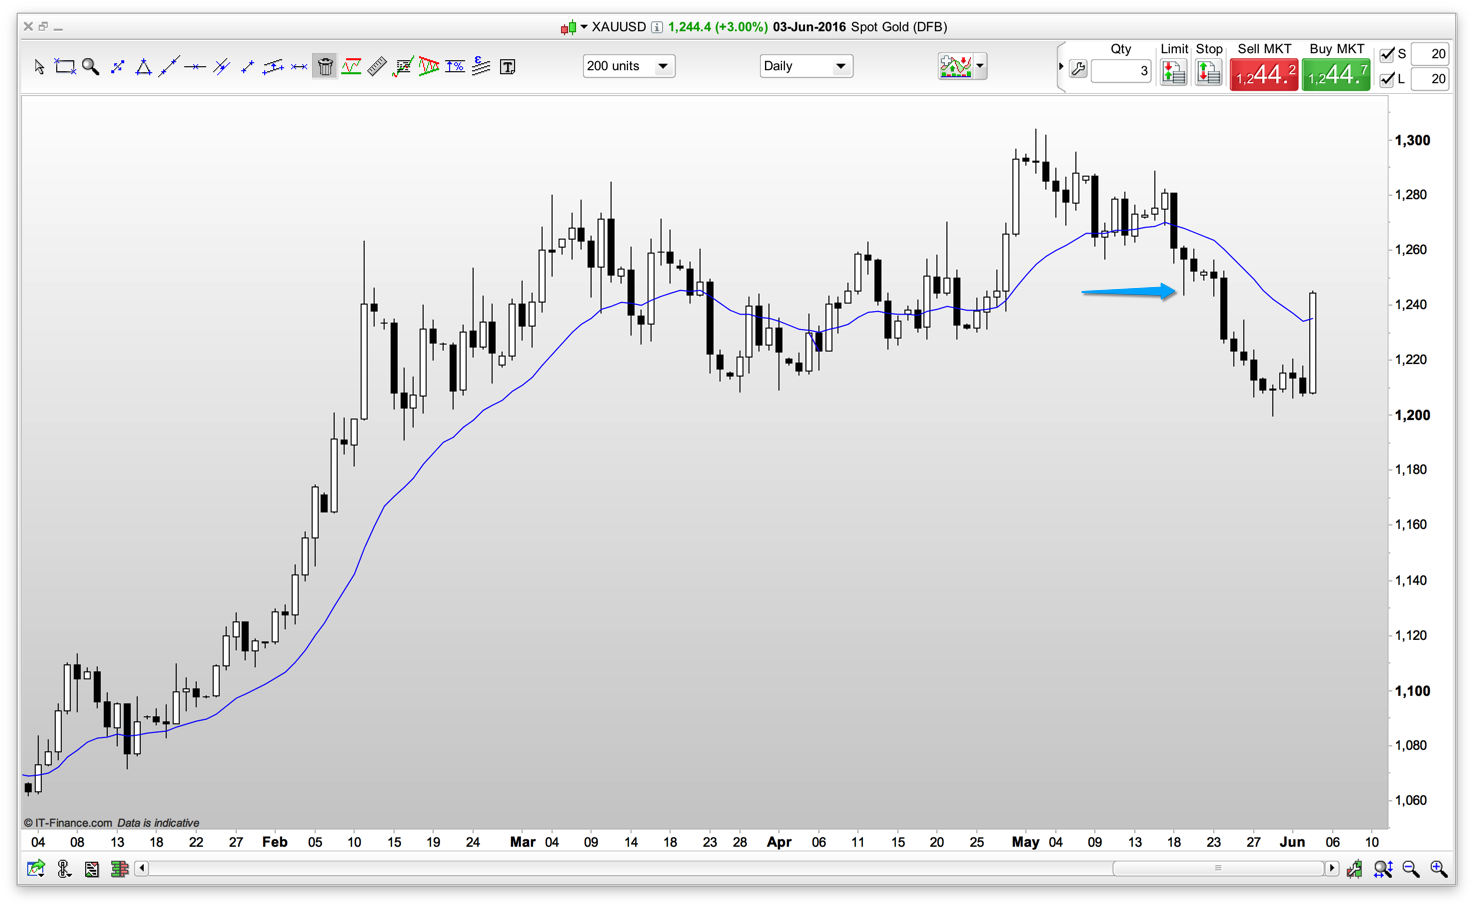
Gold below shows the short that we exited on 19th May. I was somewhat quick as the second leg down would have doubled our profit. However, the move up yesterday (similar to silver) has brought the price back to our ‘buy back’ position on the 19th. As the climb yesterday has closed above the moving average I’d expect more upwards movement next week before providing a short opportunity.
How will Brexit affect our trading? As an aside, one issue we have with trading gold and silver, particularly with a reasonable sized fund, is the size of the average bars (potential movement of price on average over a certain time period) in respect to spread. If you have bought shares in a SIPP before you will know that your broker charges you anything from £5 to £14 per trade. That is why you need to buy a certain amount of shares otherwise your broker’s fee represents too high a percentage against you. The same is true in reverse with spread betting.
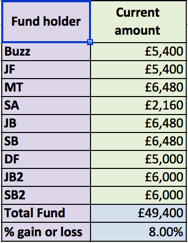
Silver, for example, has a spread of 3 pips. That is, for your buy/sell you will pay 3 pips at whatever price per pip you trade. If you trade £1 per pip, then, from the broker’s perspective, you are charged £3. (Not actually £3, you will notice that your entry line on your chart is 1.5 pips to the negative as will be your eventual exit line – with both together equalling 3 pips). That’s fine at £1 per pip, and actually a good deal. However, you ain’t going to retire soon on £1 per pip in silver. Our fund trades more in the region of £10 to £20 per pip; and that represents a high broker’s fee if the trade goes against us.
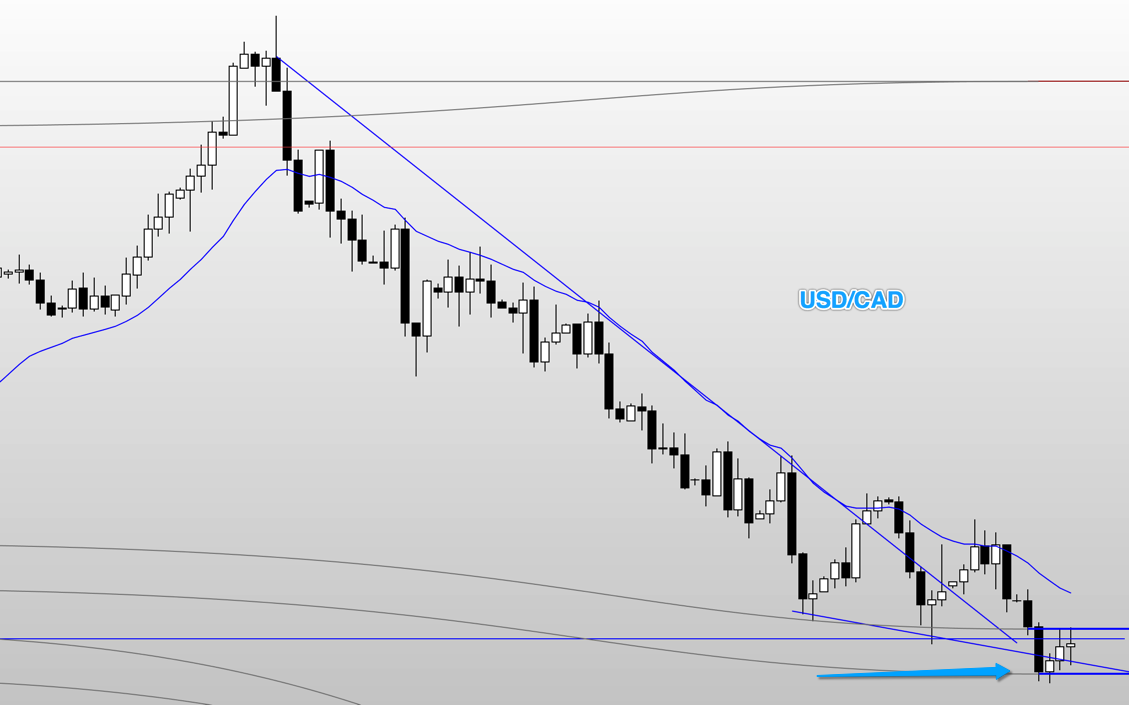
Far more representative of average bar size – when compared to spread, and also compared to the amount we wish to trade – is the currency pairings GBP USD and GBP JPY. The spread on these are about 2 pips and 3 pips respectively (I say ‘about’ because they do fluctuate, particularly in times of high volatility). However, typical corresponding bar sizes of the above currency pairings (GBP JPY being the biggest) are 10 to 20 times bigger than say gold or silver. And that is why we need to move most of our fund trades to the currency pairings.
That brings me to the initial question, how will Brexit affect our trading? Clearly we all know that it will be a time of high volatility in GBP and anything in association with GBP. To that end, the spread will increase significantly. This will need to be carefully monitored. But spread increase is okay if average bar size increases in unison. Brexit could provide a lot of barbed wire (bars that bounce up and down but close fairly tight and don’t actually go anywhere) or, of course, it could set-up a great trend. My own thought is that it is going to be a bit of both and we need to read the movement well to take advantage. So are we going to trade during Brexit? probably not on the 23rd June, but for the run up – most certainly we are.