October and November markets were slow months, to say the least. The S&P 500, for example, was in negative territory for most of this period, struggling to hold above the 50-day moving average. Not ideal when I trade long only, by choice. That said, things have changed for the better recently, with a hesitant yet rising market. Let’s see how that manifests as we go into the New Year.
Turning a small account into a big one within a reasonable timeframe has required a slightly modified approach. At the same time, we don’t want to risk the account unnecessarily or wildly. No point in putting in all the time and effort only to experience, at some point, a damaging drawdown. Therefore, what and how I trade matters.
With a larger account, I’d trade stocks in the $3- $30 range. I would also, where I could, add to a trade as and when it arose. That is very different when the account is small. Small is relative, in this instance under £10,000, and probably anything up to $25,000, depending on market conditions. Thereafter, I’d have the flexibility to play across a broader range of stock prices.
While the account is in the small range, I’m ideally looking for appropriate stock trades in the $1.5-$4 range. Why? Well, with a small account, I’m pretty much limited to a single trade per day. That brings its own challenge. Patiently waiting for the trade of the day, but not hesitating when it arrives, even if that is in the first few minutes of my day—rare, but it does happen.
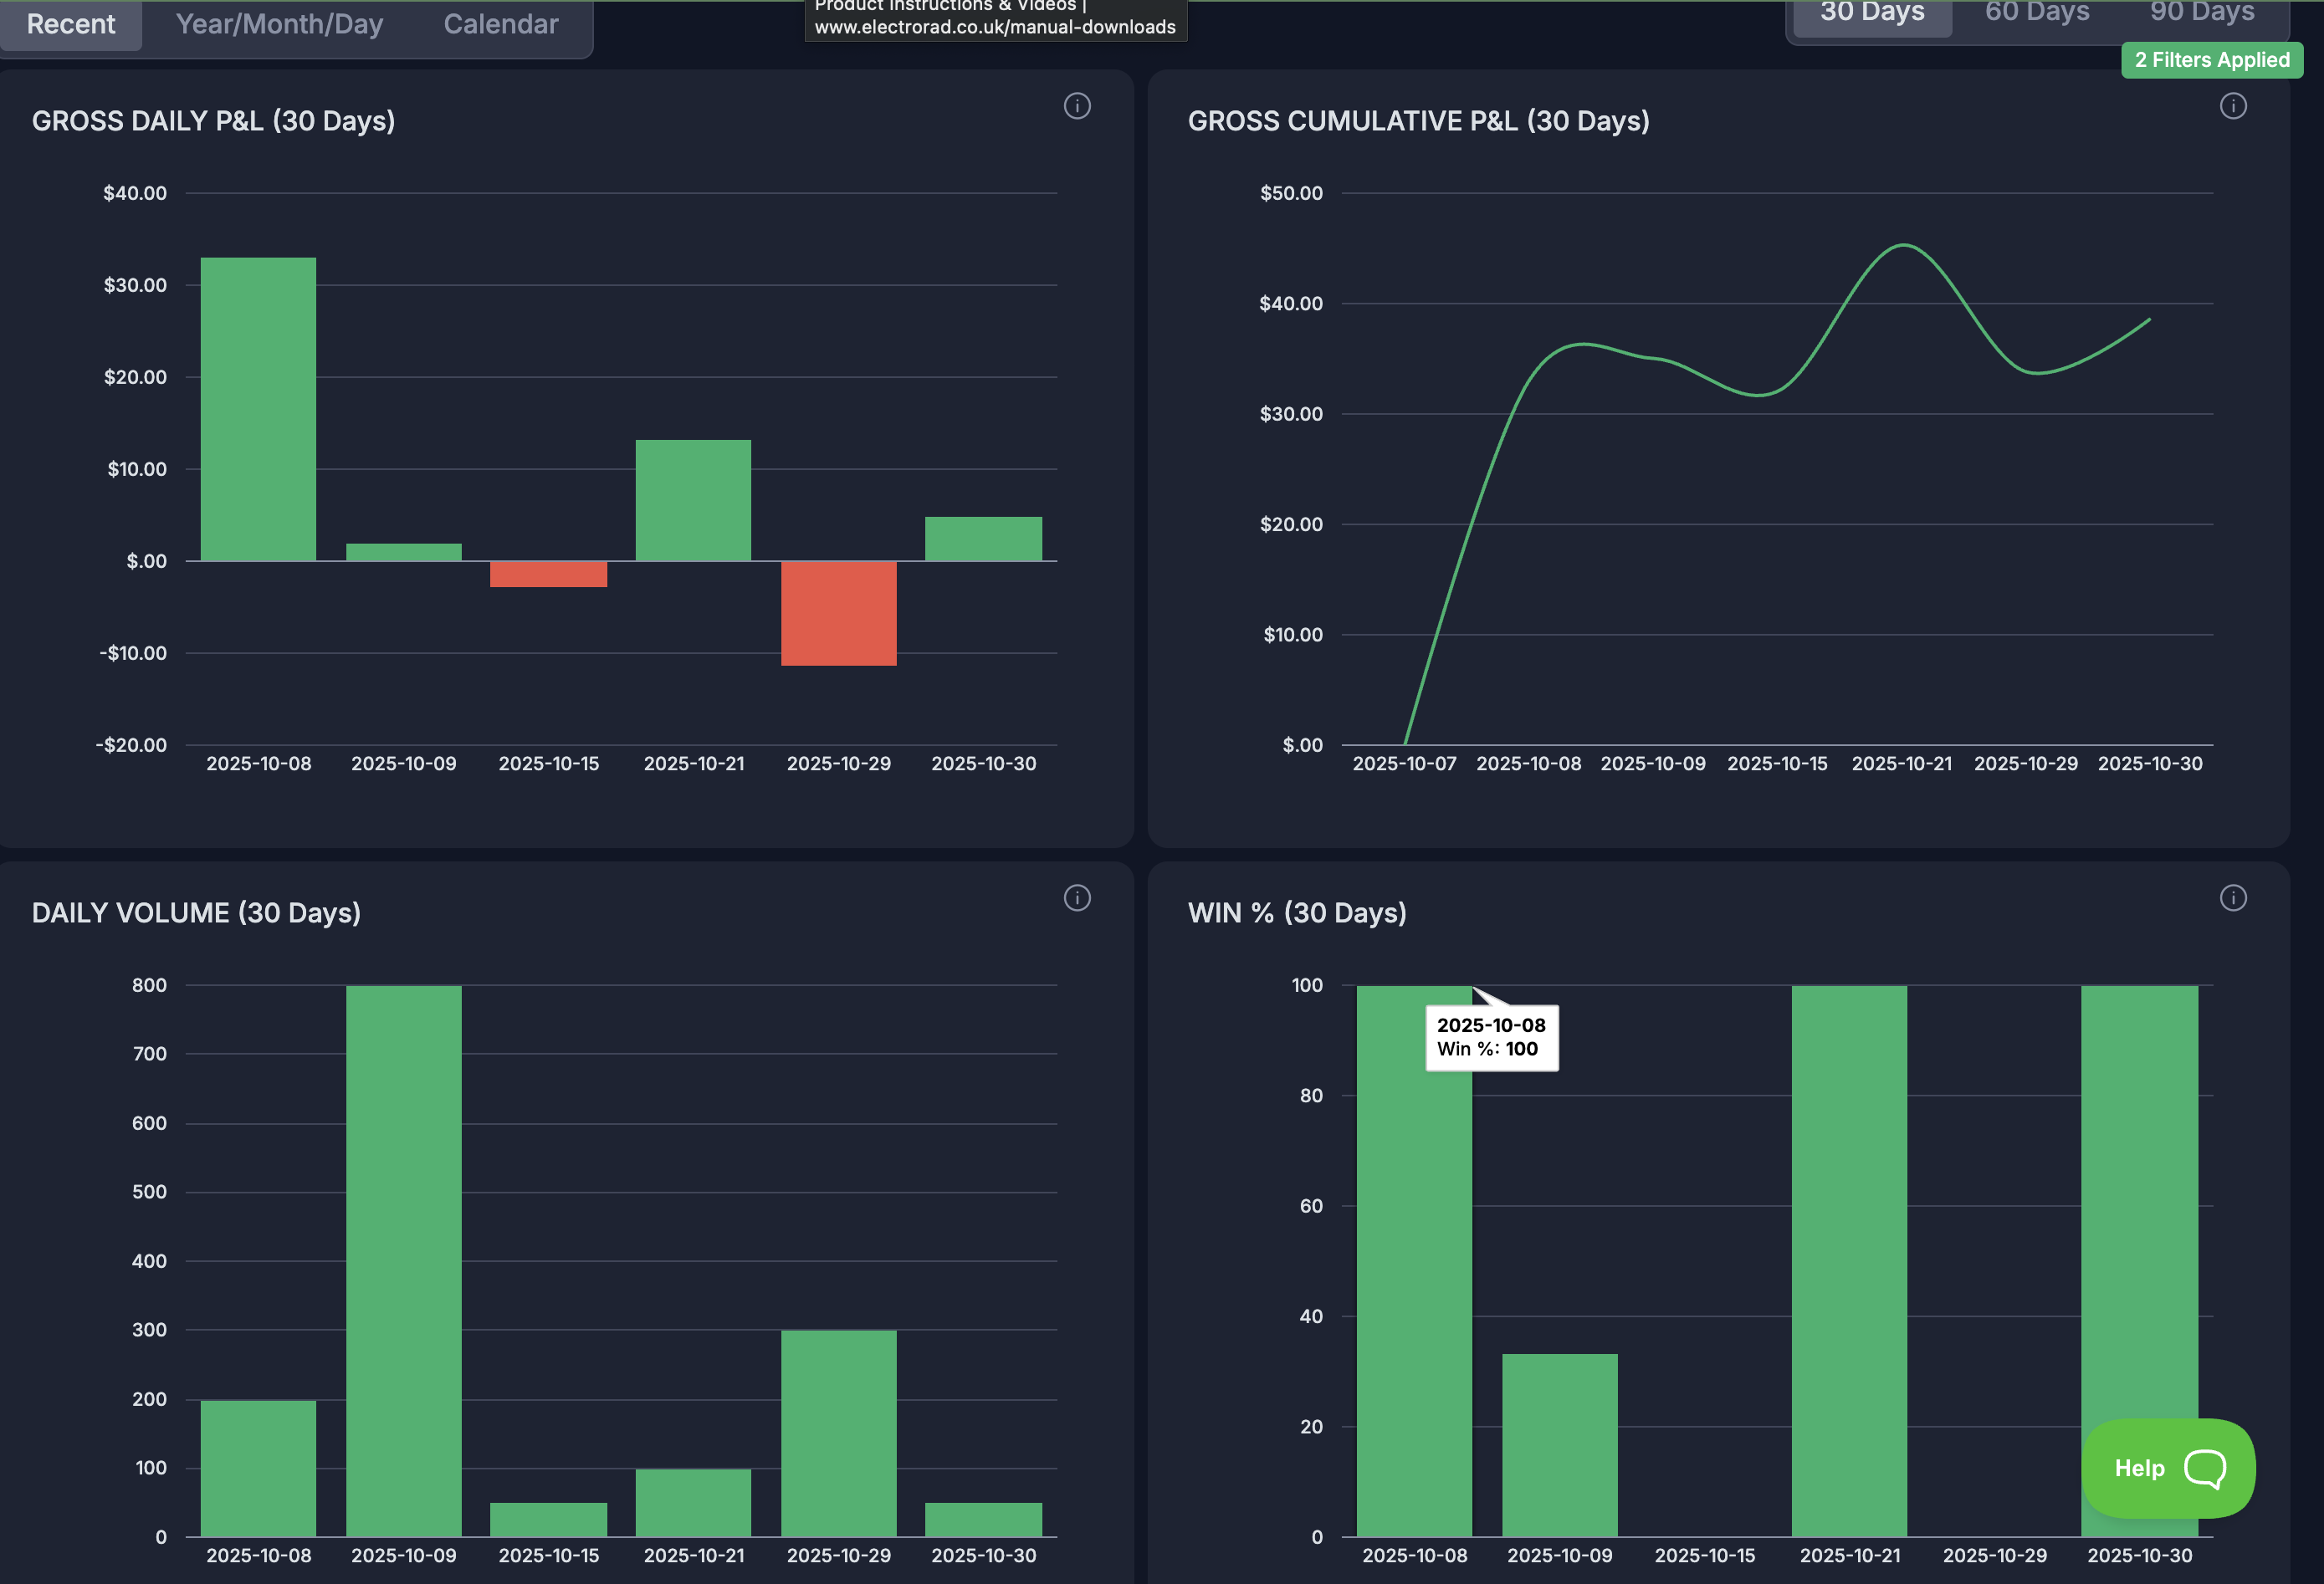
The small account needs to grow, ideally, at 10% per day. If I take, say, 100 shares of a $20 stock, I’d need to be confident of a whole two-dollar increase in share price to achieve my daily goal. Not factoring in the spread and trading costs. With a $2 stock, however, in which I purchase 1,000 shares, I need that stock to rise by only 20 cents.
A small account only gives me one throw of the dice per day, so where I can, I will weigh it to our advantage. That is fine in theory, but in practice, I have recently taken higher-priced stocks as other opportunities were not happening.
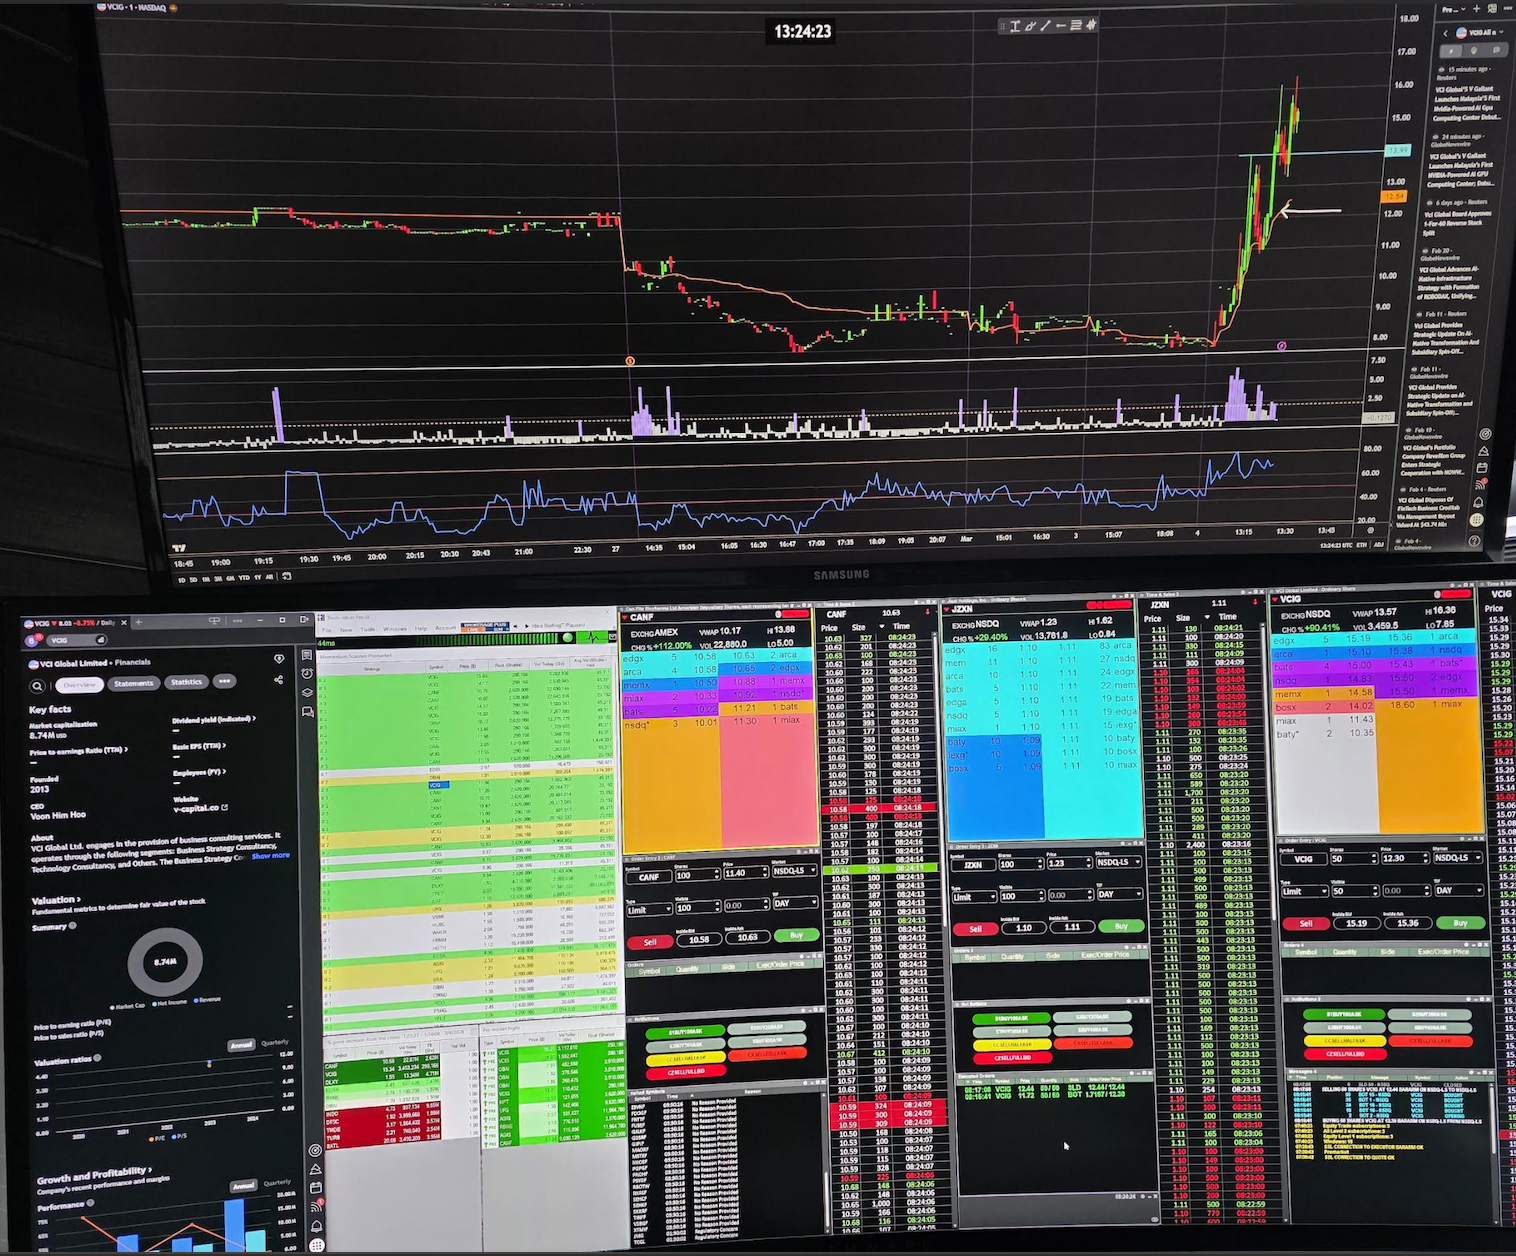
The level 2 platform is essential for me, even with ‘tape’ spoofing and so-called icebergs. Not so much in the lower-priced division, but they are still prevalent. Level 2 is only one trading mechanism; for me, it harmonises with charts and fundamentals. In charts, I removed the bars for a while, showing only indicators, so I forced myself to balance the chart information with the level 2. That helped, and I will do it again from time to time where my personal recalibration is needed.
Let’s quickly review my trading style. It is a very short-term reaction to potential bullish movements in specific stocks. Specifically, what are known as low-float stocks? Those are stocks that, in most cases, have less than 10 million shares (the float) available and have a relative trading volume significantly above the available float.
I first screen potential stock candidates on the Trade Ideas AI platform by volume per minute. Thanks to ‘Bullish Bob’ for his help with programming Trade Ideas the way I like it.
Once a stock pops up on the scanner, I also like to see positive, relevant, and timely news associated with it. If the stock is associated with the pharmaceutical industry, crypto (when crypto is positive) or AI, so much the better. Of course, where the stock is based is a factor too.
A glance at my level 2 shows how active or inactive the stock is, along with factors like the spread and trading depth.
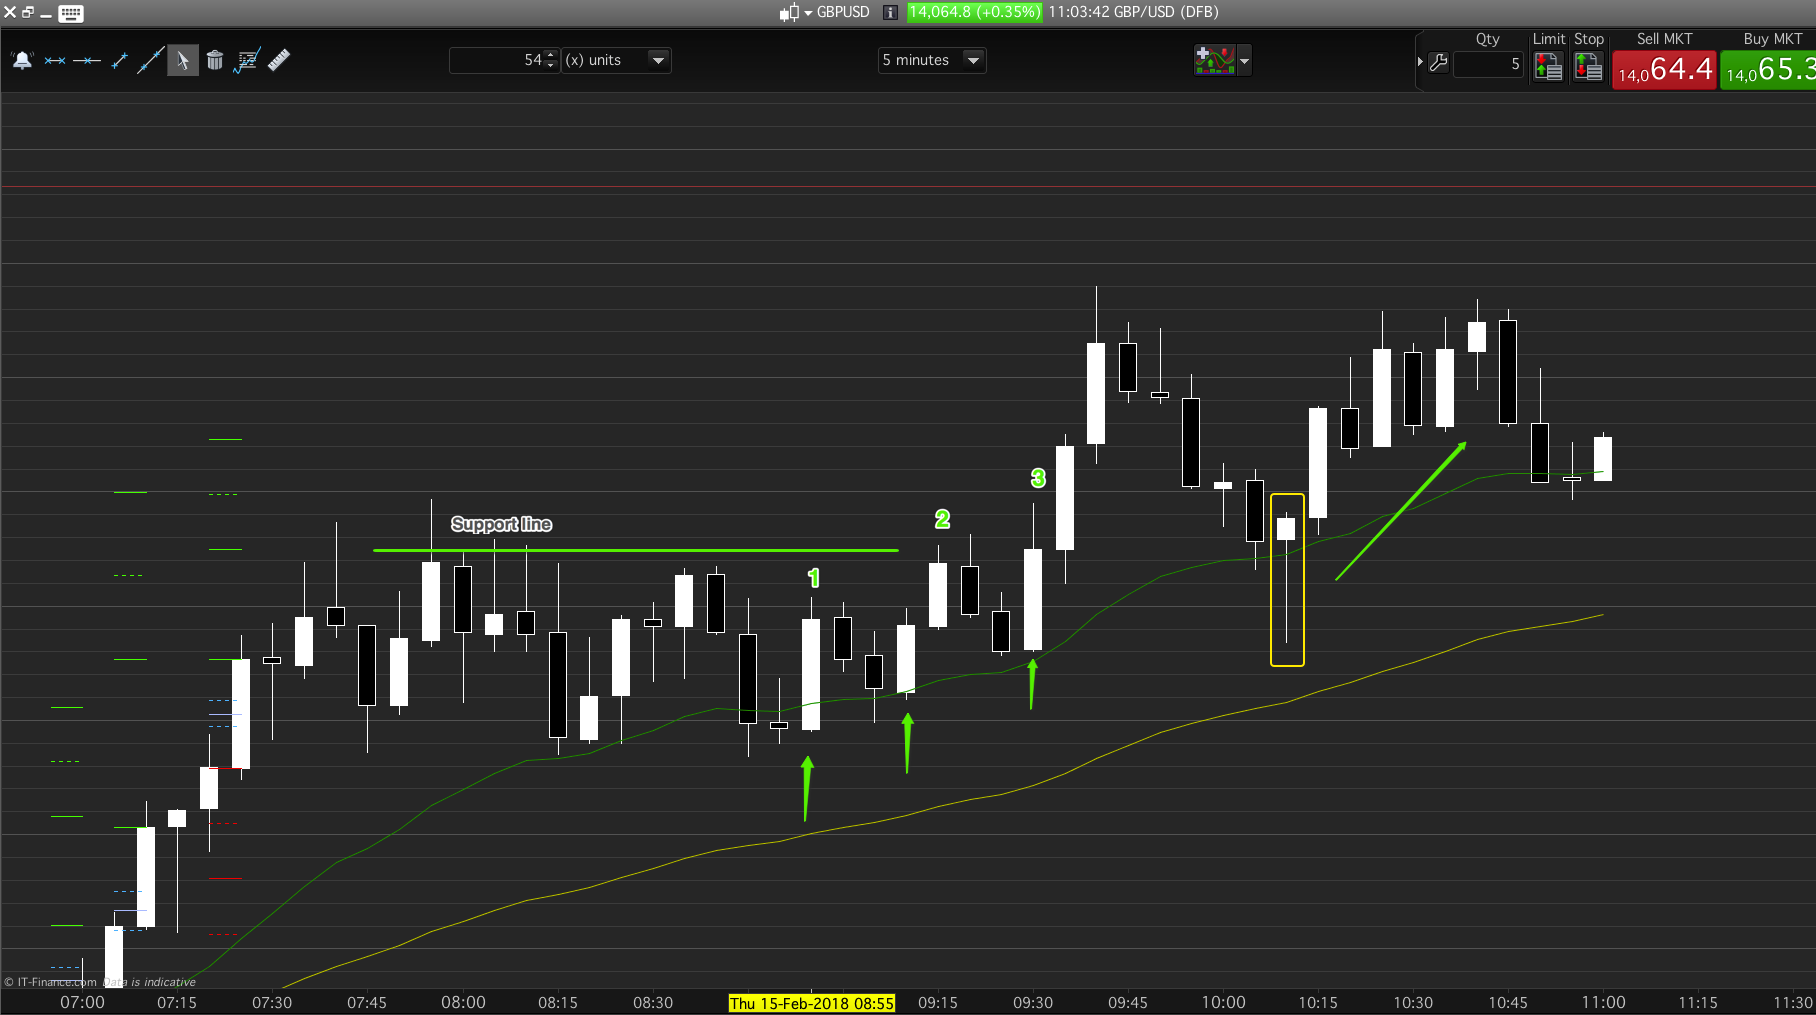
At this point, I study my bar charts. Firstly, the daily price relative to the daily 50- and 200-day simple moving averages. Not the most advanced technical indicator, but remarkably accurate at identifying resistance levels. Next, the 5-minute and 1-minute charts provide context and resistance levels, along with potential short-squeeze price levels. (They can sometimes be the 15-minute and 2-minute). Volume, particularly on the 1- or 2-minute chart, provides me with a green (good to trade) or red (don’t trade) flag.
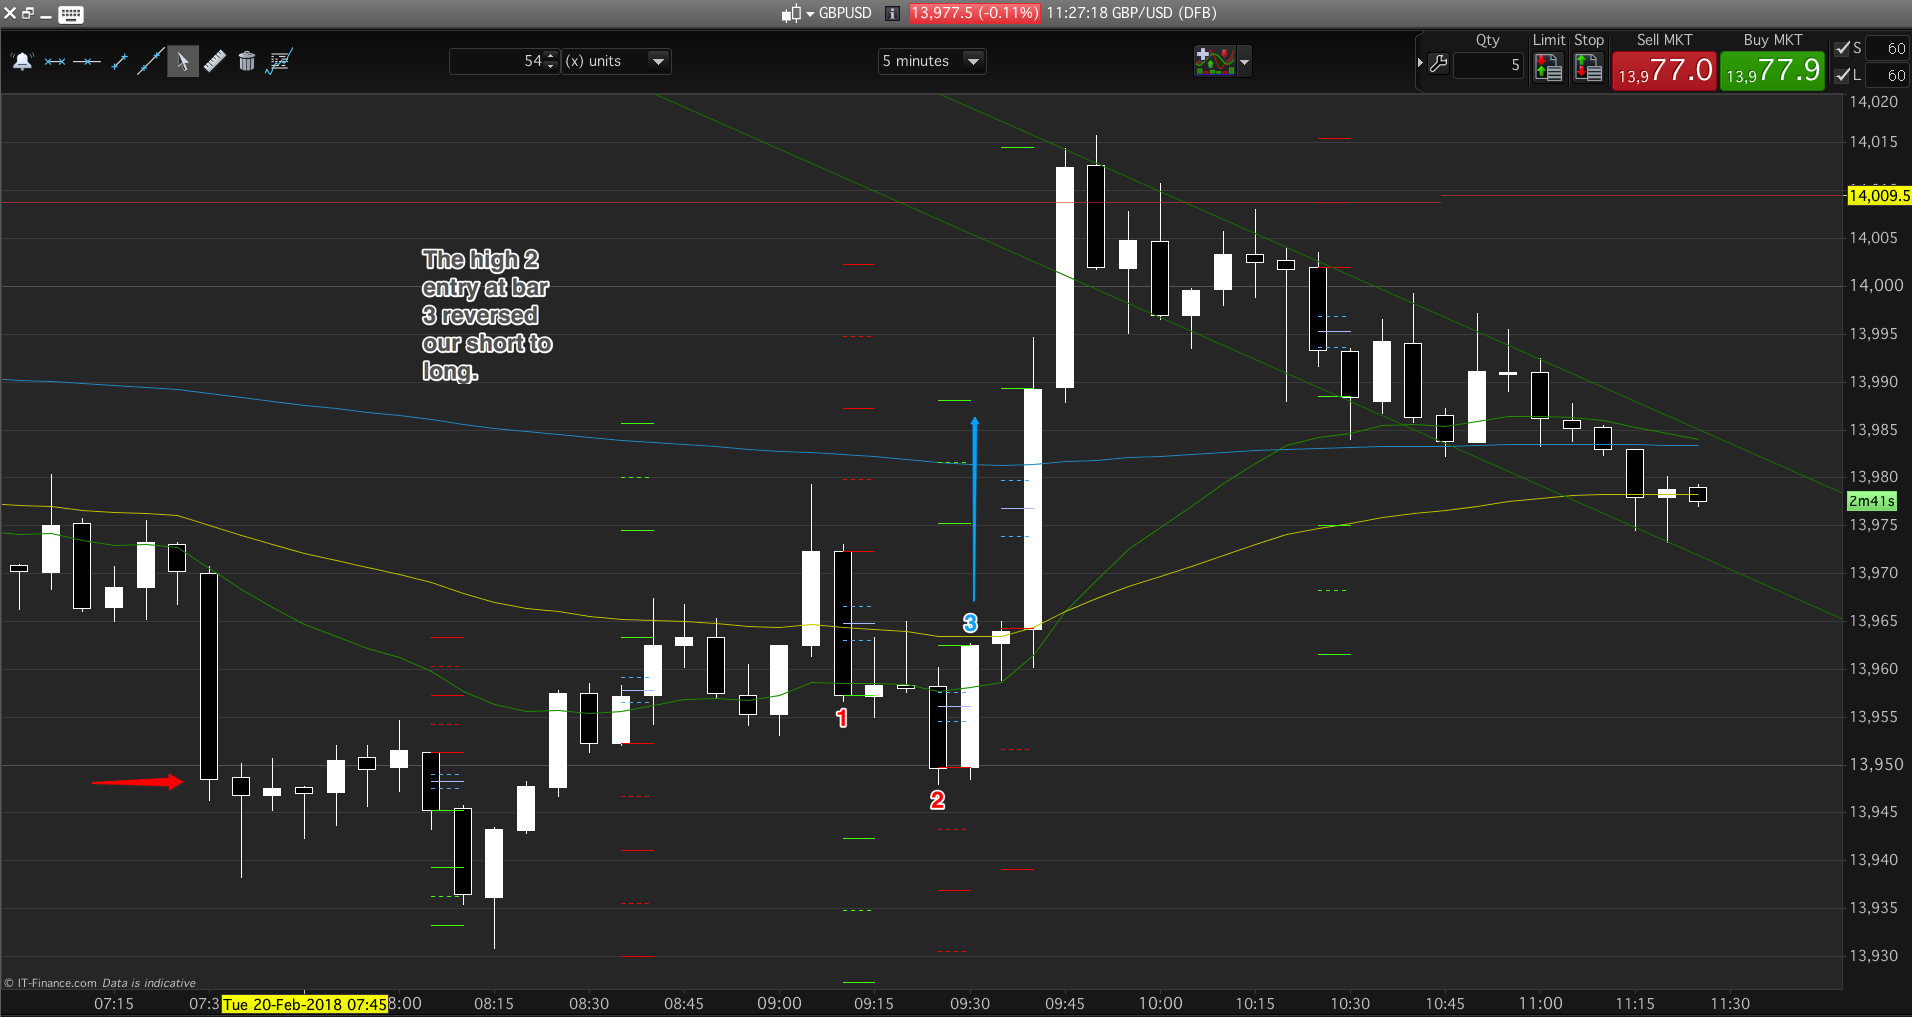
Setups, however, are from the intraday chart, either the 15 or 10-second chart. I favour the 15-second at the moment, but that can change with volatility. I cannot stress the need for a credible setup enough.
As I am, for the most part, a momentum trader, I usually buy via hotkeys at the offer price and, conversely, sell at the bid price.
After that, it’s over to level 2. Watching the number of bids and offers coming in, the movement, if any, in the spread, the bid and offer (or ask) price and how it is reacting to certain price levels, combined with the rapid, or otherwise, movement of the time and sales.
All tells a story that allows us to fleetingly look into a possible future scenario with level 2 and judge the reaction to, and what is happening right now, through time and sales.
Side note. A couple of months ago, I moved the blog’s domain to WordPress. In the process, I lost over 660 posts. Retrieval via the Wayback Machine (web.archive.org) is possible, but it requires extensive copying, pasting, and reformatting.