Category: Slow Trader Hedge Fund

  • The remaining top share picks on a chart

    To complete our take on the remaining top ten FTSE 350 shares here’s the final few from last week. As I’ve explained, the main purpose for these shares is their fundamentals. As we are looking at particularly long-term holds the chart (even a 10 year weekly bar chart, as shown below) becomes irrelevant. However, it’s always nice not to have to spend the first few years of ownership out of the money. Therefore, please do your own due diligence but these charts may help.

    Zoopla has a clear 3-wedge up which could signal a pull back. However, if the pull back is weak there is a reasonable probability of a measured move up of the whole wedge, to the 600 area. 

    There is a 50% probability of a pull back with Wizz to the 1,300 area, as marked below. However, price is currently centrally located in a possible big trading range (TR) so a push up to the top of the marked TR is a consideration. The big TR will only reveal itself after another touch at the top and bottom.

    Shire is a lot at 5,000. However, do not misinterpret this as expensive or over valued.  Price and value, in this sense, as we know, are not correlated. Pharmaceutical companies are liable to large share price movements. Shire being one of the more stable for reasons that our further due diligence will reveal. Again, we are looking for a break out here from its previous high of about 5,750 or a pull back to firmly cement the bottom of the trading range.

    Whatever your thoughts might be about a company such as Playtech – online casinos and the like – it has been a consistent member of our top ten. Since 2012 share price has more than tripled and from our fundamental calculations is still only 50% of its future value. The last annual report for Playtech was at the end of 2015, so I’m waiting to see what the next results provide.

    The FTSE 100 is largely influenced by the big commodity companies, even though it is weighted by market capitalisation. Therefore I’d be reluctant to use the FTSE 100 as a barometer for our top ten shares.

  • Know this one thing and save £15,000 as a trader.

    snip20170304_34

    Knowing the timeline above would save traders £15,000, on average.

    Paper Account:

    Most people start trading with a paper account. That always goes well. However, it is not reality. Pip Maven recommends that a paper or dummy account should be for no more than 4 weeks, enough time to get familiar with the broker’s site.

    Beginner:

    We then become a ‘beginner’ trader. We trade small, and to survive this stage trading small is vital. During this phase we try many strategies, follow many teachers. One minute we think we’ve got it, the next we haven’t. It’s also the rollercoaster phase.

    “The Dip”:

    The Dip, by Seth Godin, is well worth a read. A short book but explains how the dip applies to everything we try. And trading is no exception. We can enter the dip at any point, not necessarily at the end of the beginner phase and  before the intermediate phase. It could be half way through the  intermediate or just before expert – but go through it we will.

    Intermediate:

    This, as Pip Maven explains, is where a trader has settled down to the grind of it all. No longer looking and changing to everyone else’s system, but focusing on our own, unique, way of trading. Managing our trades with attention to the smallest of detail.

    My drawing above is not to scale. If we picture the beginner phase compressed into the goal area of a football pitch, the remainder of the field is the intermediate phase. This, as a minimum, would be more representative. 

    Expert:

    If we survive the intermediate phase, or the grind, then we have a chance of achieving expert level. And, of course, that is where all the benefit is.

    Save £15,000

    How do we save £15,000? Simply by being aware of the above phases. When and if we make the intermediate phase we realise that this grind is part of the game. We do not get frustrated and do something daft. On average traders do something daft during the intermediate phase – it’s a long time after all – and lose £15,000. Now that we are aware – instead – we stay with the programme, whatever it takes, to achieve expert.

  • Top ten companies that are selling at a discount – FTSE 350

    On the previous blog, also dated 25th February 2017, Nick has provided the list of companies from the FTSE 350 that made the grade for our long-term investment.

    The spreadsheet was the cumulation of focused effort by Nick and me over a 9-month period a few years back. Nick, spent, subsequently, a considerable amount of time improving the calculation.

    Here’s an example of the back sheet of information that is taken for up to 10 years of figures for each company in the FTSE 350 – and this does not show the mind numbing calculations that are used within each of these boxes.

    screenshot-2017-02-24-11-15-36

    We must emphasise that this is meant for longer term investment. The principles of which use many ideas from the great investors, but primarily that of Benjamin Graham and Warren Buffett – and, if you know these investors, we are talking longer term.

    Nick has only provided FTSE 350 as the information is aimed at UK ISA or SIPP investors.

    Here is a synopsis of the filters of the principal figures used: “and, we have to say, principal figures that cannot be found anywhere else” 

    Margin of Safety: price is less than 60% of value

    Age: more than 4-years trading with less than 2-years of negative earnings

    Growth: a growth rate greater than 10% to ensure a reasonable rate of return

    Consistency: 10% growth rate in all variables – consistency score greater than 60%

    (Blackberry conundrum: consistency of growth improves over time)

    You will notice, in the more detailed sheets below, that annual report dates can be over 12 months old. That is because of the release time of annual report information. Although we are long-term investors with this information, Nick will run the calculations every few months to capture annual result information reasonably early.

    Here is the more detailed, and most up to date annual report information, on each of our companies that made the cut:

    snip20170225_2

    snip20170225_4

    snip20170225_5

    Finally, anyone using this information to invest we must, of course, point you to our disclaimer page. Also, it is important that individuals do their own due diligence. It is important that, as investors, we understand the company we are investing into. The information above is detailed but we must determine for ourselves if we think a company has legs for the longer term.

  • Which companies make the grade for long-term investment, FTSE 350

    Name

    Ticker

    Sub Sector

    Crest Nicholson Holdings Ltd

    CRST

    Home Construction

    B&M European Value Retail SA

    BME

    Broadline Retailers

    ZPG PLC

    ZPG

    Media Agencies

    NewRiver REIT PLC

    NRR

    Retail REITs

    Shire PLC

    SHP

    Pharmaceuticals

    Wizz Air Holding PLC

    WIZZ

    Airlines

    Playtech PLC

    PTEC

    Gambling

    Hikma Pharmaceuticals PLC

    HIK

    Pharmaceuticals

    Micro Focus International PLC

    MCRO

    Software

    Hargreaves Lansdown PLC

    HL_

    Asset Managers


  • Here’s the trick, part 2

    Here’s the trick, part 1. To help emotionally, once I’ve entered a trade, I can mentally consider that the trade is lost. I don’t think of it as being part of our account. It’s gone. My true account is our total less the risk of any open trades.

    This is what the crowd is doing and therefore will lose us money. Instead, flip it.

    Here’s the trick, part 2. When I have spent most of my time waiting for a great entry consider the win from hitting my target as money in the bank. I mentally add it to our account.

    The risk of the trade represents £100, for example. As I enter the trade I mentally add the £100 to our account. It belongs to us. I’ve spent the time finding the entry, therefore, the planned result (i.e. the winnings) belongs to us.

    It’s now our money and we manage the trade accordingly – with a bit more fervour and positivity than I might otherwise.

    Our goal of not losing money includes the planned result of this trade. I don’t exit the trade because of fear, because to do so means we lose money that we know is ours.

    Unless I make this mental leap it is too easy to exit a trade thinking I can’t lose what we havent got. Wrong, it’s ours, we’ve earned it. Now pay up Mr Market.

  • How to make a million short-term trading

    The last time I said ‘its great to know that I can make money, every day, short-term trading’ I fell off the wire. Not too high a wire, but a fall nonetheless. So I’d be silly to say it again, but I’m about to. The thing is, that is what short-term trading is all about, being absolutely precise about it.

    My last fall was only a couple of months back. Prior to that I’d been in control and trading at the one million level, albeit for just a few weeks.

    What the devil is the one million level and why did you fall?

    The one million level.

    As short-term trading should be/is precise – that is, on average, we know how many trades a day meet our criteria – we can determine how much we can earn each and every trading day. Now, to most traders this sounds barmy because most traders lose. Yes, that is correct, of those that use a spread betting platform to short-term trade, and that is most traders in the UK – and the subject of a future blog – only 5 to 10 percent win. And I think it’s closer to the 5 percent. So to say that we can be precise is a long way, in the non winners eyes, from making sense.

    But lets come to that some other time, for now, what do I mean by this one million thing? Lets agree firstly on the amount of trading days available to us in a year. If we take away weekends, bank holidays and some much-needed holiday time for ourselves we are left with about 200 trading days. For me it’s somewhere between 100 and 200 trading days – as to find 200 solid, undisturbed days is difficult, and I only trade when this is so and I’m feeling good.

    However, the principle still holds. Most professionals will achieve 200 trading days in the year. If it takes me 18 months, or some figure either side, then that doesn’t matter. What does matter is how much we can earn on each of those days. Even if we’re an extremely successful short-term trader, the amount we can or cannot earn on a daily basis is based on what we can handle emotionally. If we get to the point where the amount we are trading alters the way we trade then we’ve gone through the ‘no go through’ emotional barrier. And, unless we pull back in our trading size we’re about to very rapidly join the losing crowd again. I say again because we’ve all been part of that crowd for most of our trading experience. One part of trading successfully is that we must trade financially within our ‘it doesn’t effect me’ level.

    That said, you will see from my ‘How much do we risk’ page that I have two distinct trading levels. One is designed to provide a daily amount of £500 a day, and the other £5,000 a day. The £500 is just the build-up to the £5,000. And the £5,000 a day, when we multiply that by our 200 trading days, gives us our one million. Professional traders will build-up in stages. Once £500 is achieved they will next move to £1,000, and so forth. I’ve already built up and been at the £5,000 level – right up until I fell off the wire – so I know that, emotionally, I’m fine at this level. I’ve also found out why I fell off and I’m fixing it.

    I should work for 3-months at the £500 daily level and move up to the £1,000 level for a further 3 months before going again up to the £5,000 daily level. However, I don’t need to prove to myself that I’m fine emotionally at different levels so I’m staying at the £500 level for the whole 6 months, or until I know that I’m ready, and then move straight to the £5,000 daily trading amount. That is because the risk/reward calculations for each trade (£500 and £5,000) are the same – I simply add a zero to my trading amount. The transition to £5,000 daily trading is, for me, easier this way as the well practised mental calculations are the same – just one zero bigger.

    In my last blog I talked about the very important ‘edge’. This is a dramatic word so instead I’m going to call it my ‘green line entry measure’ (GLEM). One of the reasons I fell from the trading wire, so to speak, is because I hadn’t properly defined my GLEM system. Or in other words, my final reason for why I’d enter a trade. As I trade over the next 6 months at the £500 level I’ll develop and prove my GLEM system more and more. A further reason for my fall is my weakness to trade a trending ascending market. We all have favourite cycles within markets – some traders build their entire strategy around a certain cycle and will wait for as long as it takes for that cycle to come around. I’m good in the trading range and descending trend cycles but, as I say, lousy at an ascending trend. That needs to be solved and is one of the reasons I redefined my GLEM system.

    So there we have it. Our goal is to achieve a million return from 200 trading days. Which for me, after the 6-month preparation, will take, realistically, between 18 to 24 months. That’s the challenge.

  • The secret to profitable trading

    Okay, as promised, here it is, the secret to making money from trading. And, you will not be surprised to learn that as a quick solution to getting rich – it’s not.

    There are so many ways to trade it would be near impossible to compile a comprehensive list of them all. However, there are three broad categories that most would agree on.

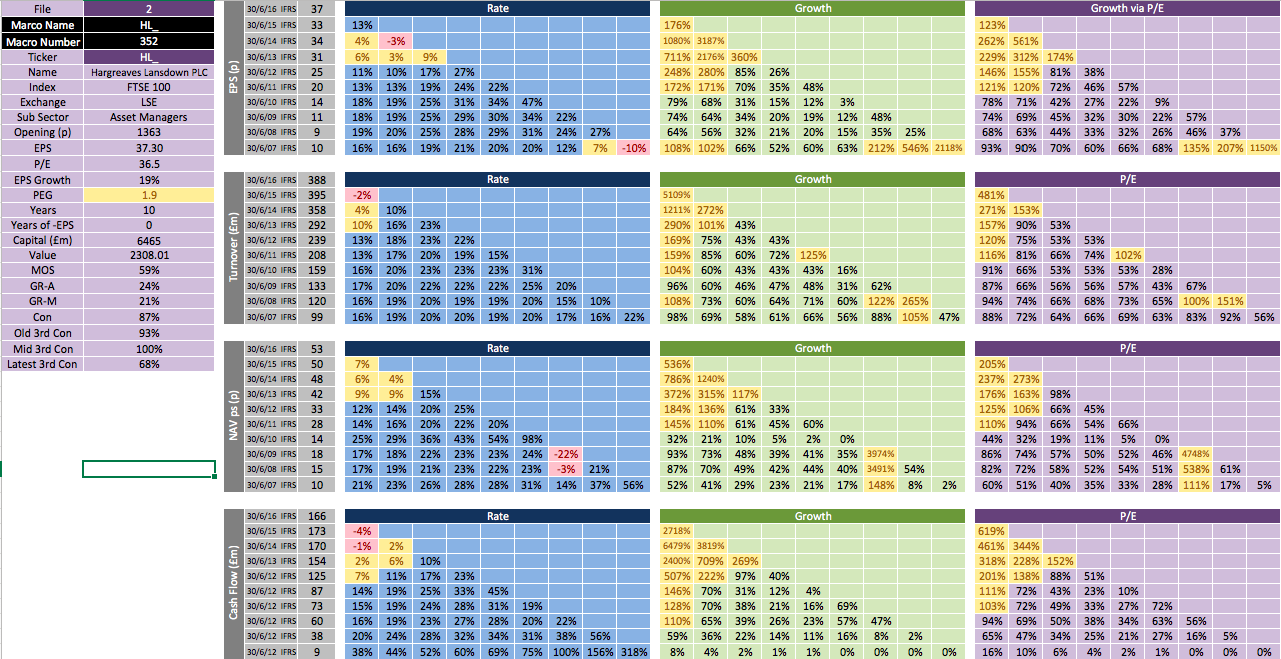
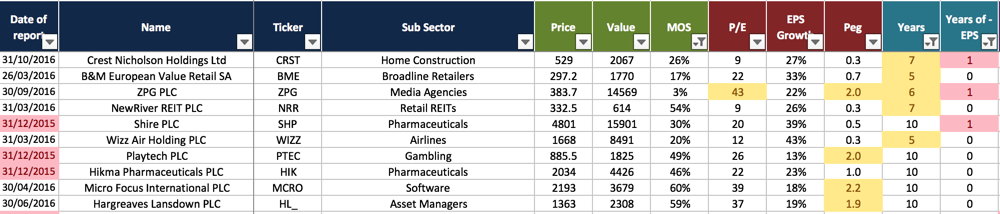
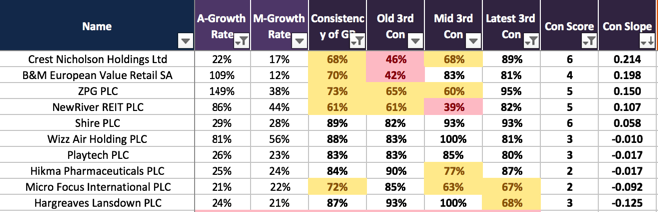
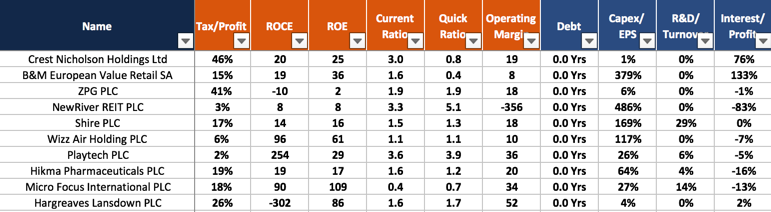
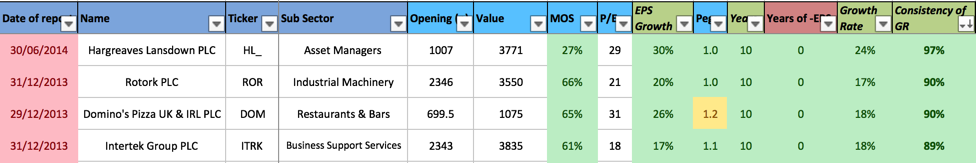
    (1) Trading through company figures is known as fundamental trading. It’s generally considered as long-term trading and is probably the original bedrock of all trading. I love fundamental trading and developed my own knowledge of it over several years. Through Nick’s spread sheets we have a great solution to choosing long-term trades. Personally, I did mess this up when I tried to use the fundamental information we generated for short to medium term trades. That was an expensive lesson.

    (2) Trading through the use of charts is known as technical trading. It is often difficult for a ‘fundamental trader’ to accept that charts can be read. And for good reason too, there is a lot of guff provided about reading charts that make it difficult to accept as a viable trading method. Nor does a fundamental trader need the confusion of technical data messing up her fundamental decision. Again, I’d like to put my hand up and admit to trying most technical systems and finding that I couldn’t, until recently, get any of them to work consistently.

    (3) The third consideration is a mixture of both basic trading structures. As if it wasn’t confused enough already. Yes, tried that. Not a great success story.

    In very broad terms, holding a trade for anything outside of nine months is probably best left to the fundamental trader and anything inside of that time is technical territory. We know that long-term fundamental trading works, ask Mr Buffett. But even he tells us of the multitude of mistakes that he had made. But in the end he certainly had the edge.

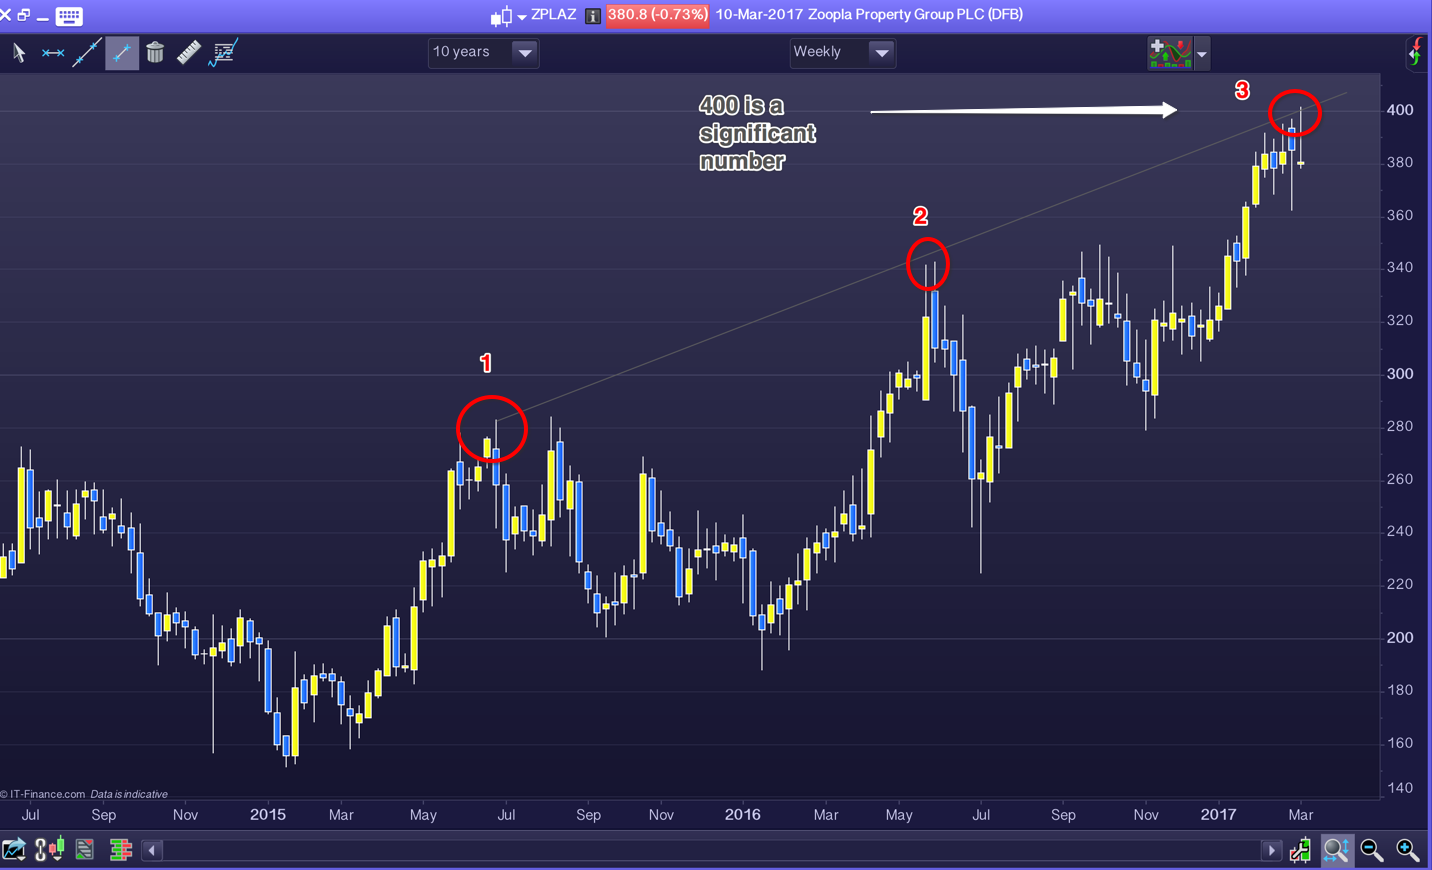
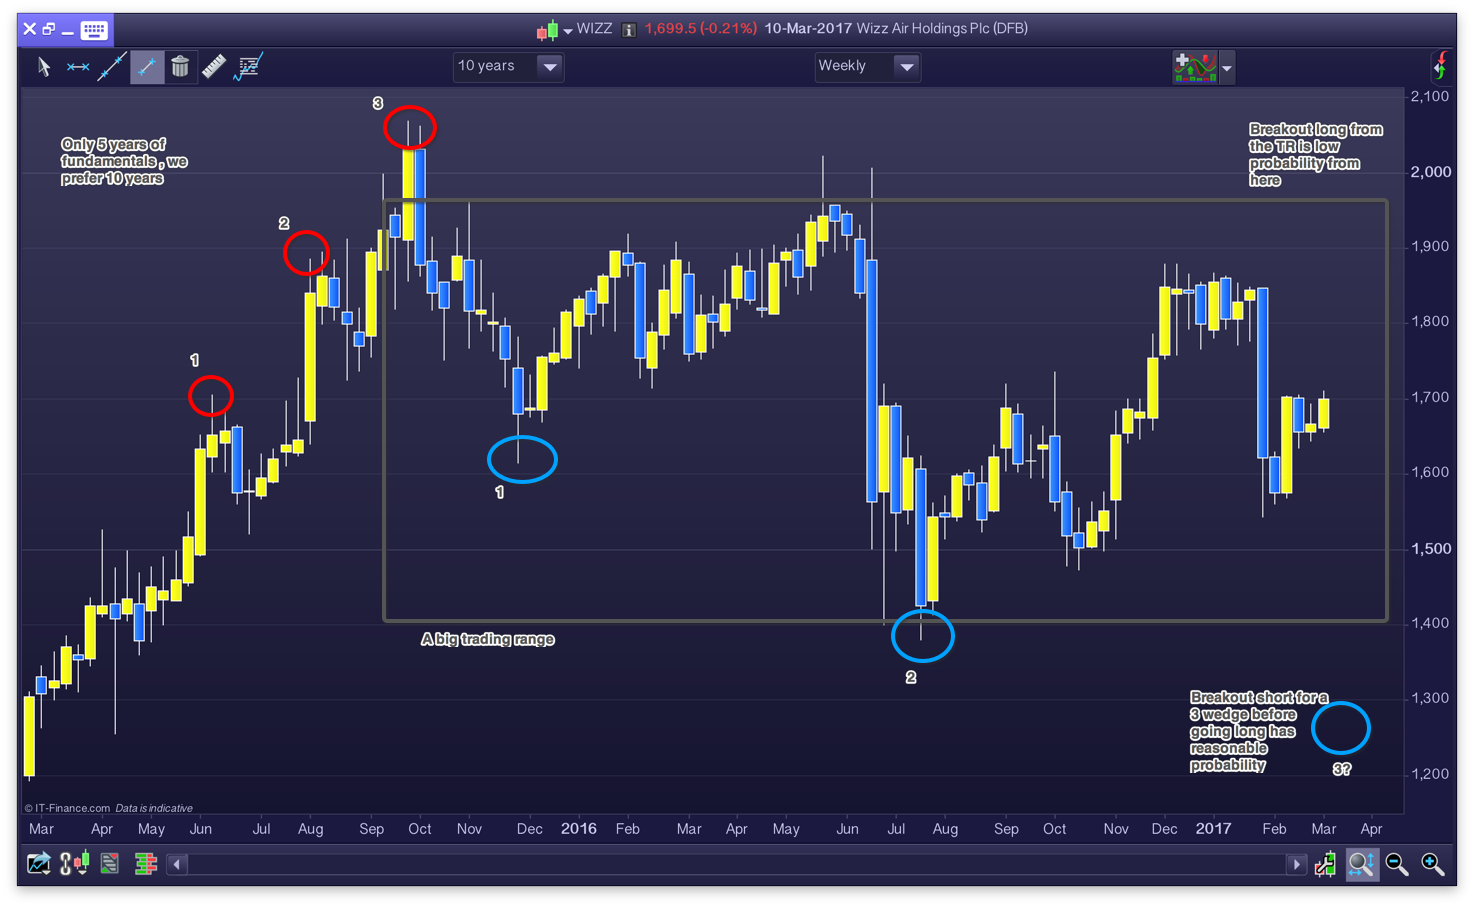
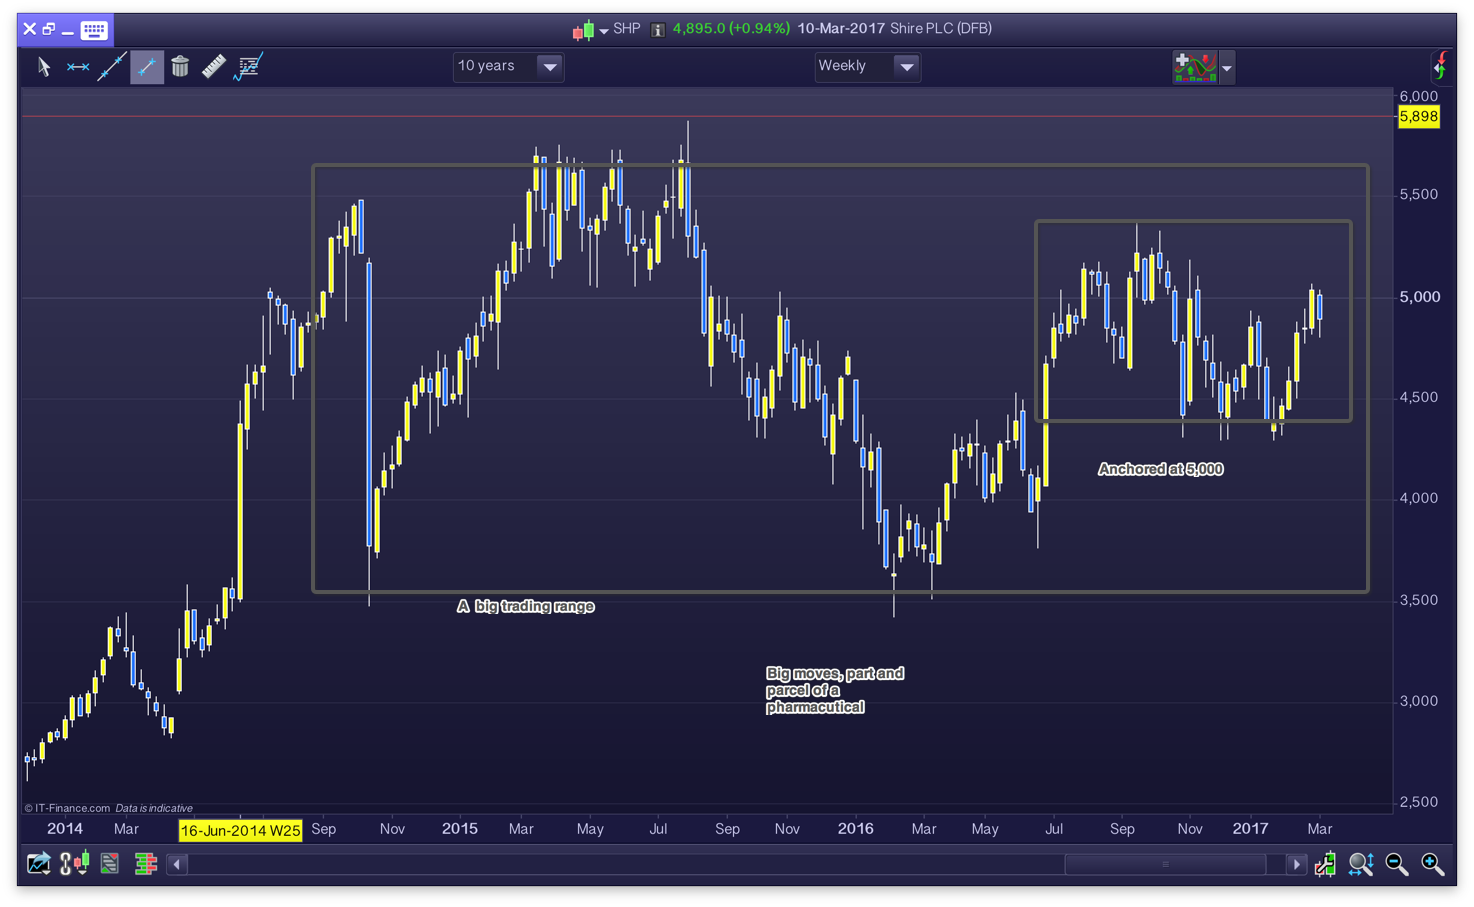
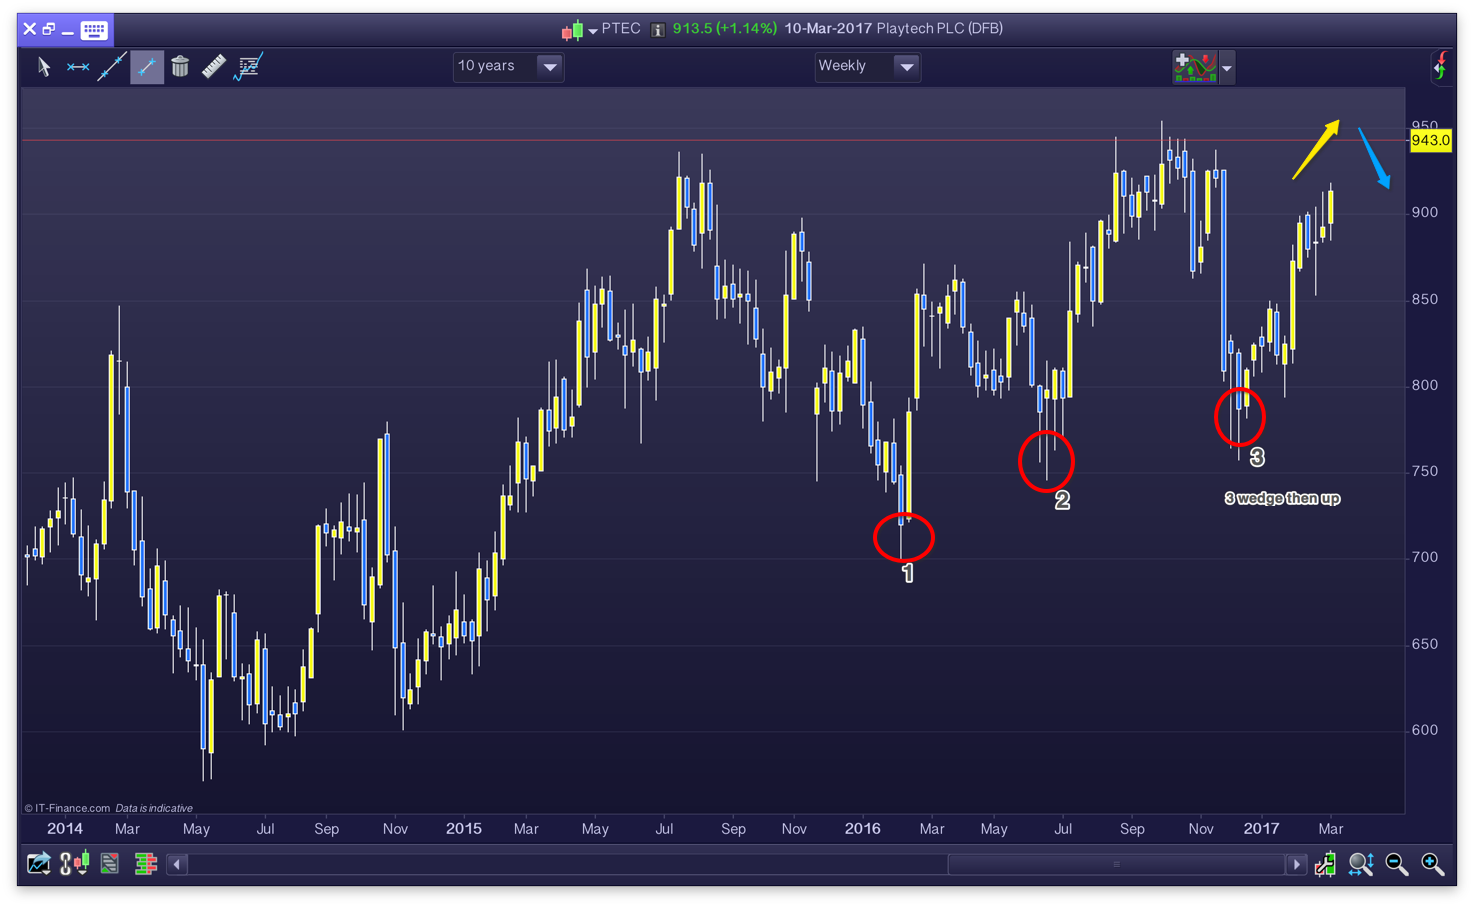
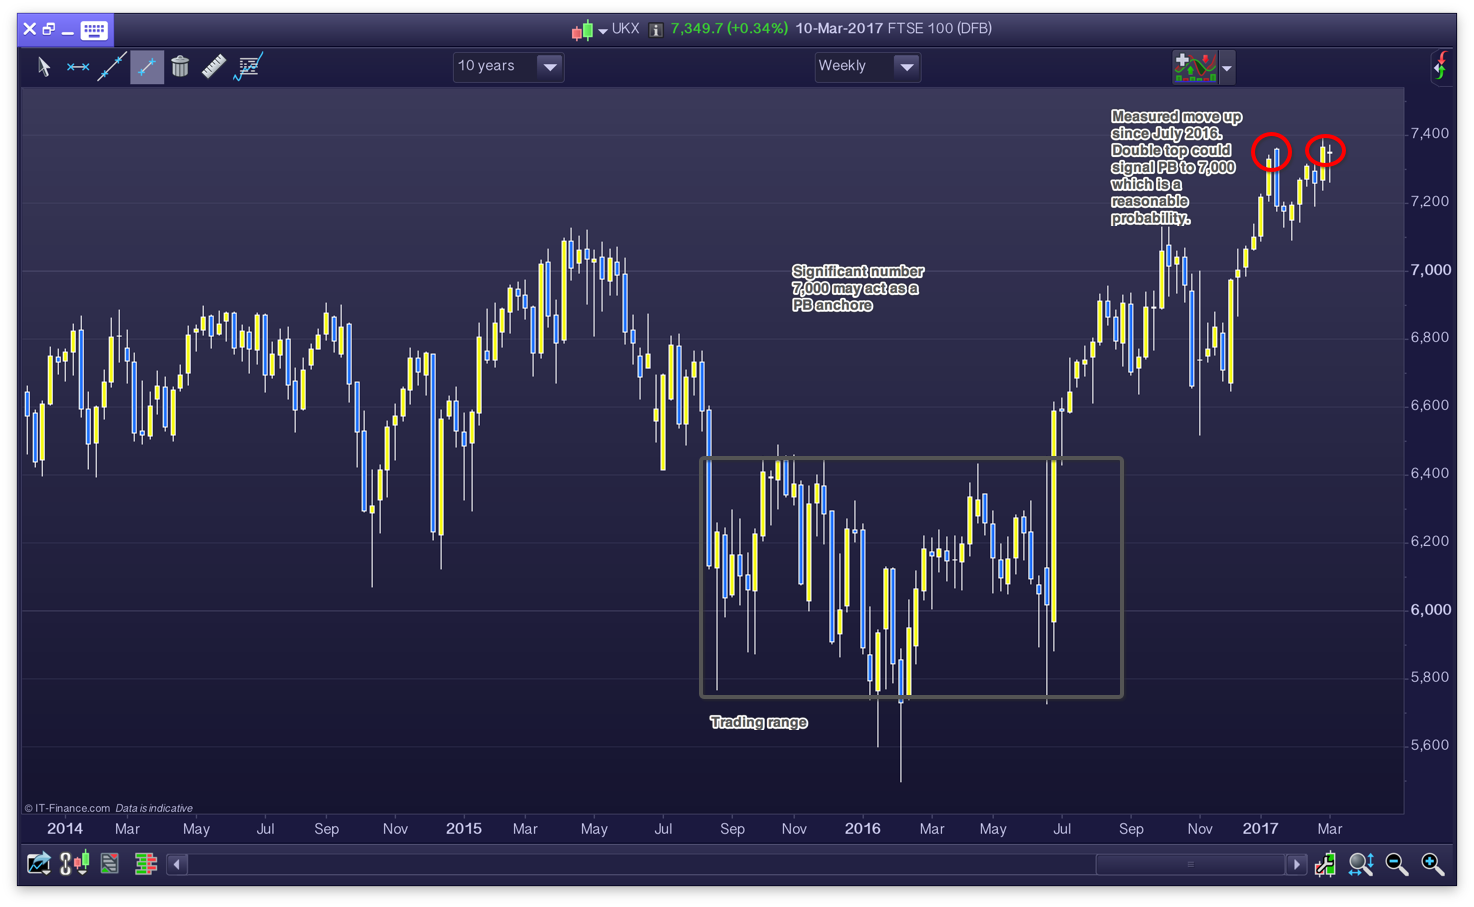
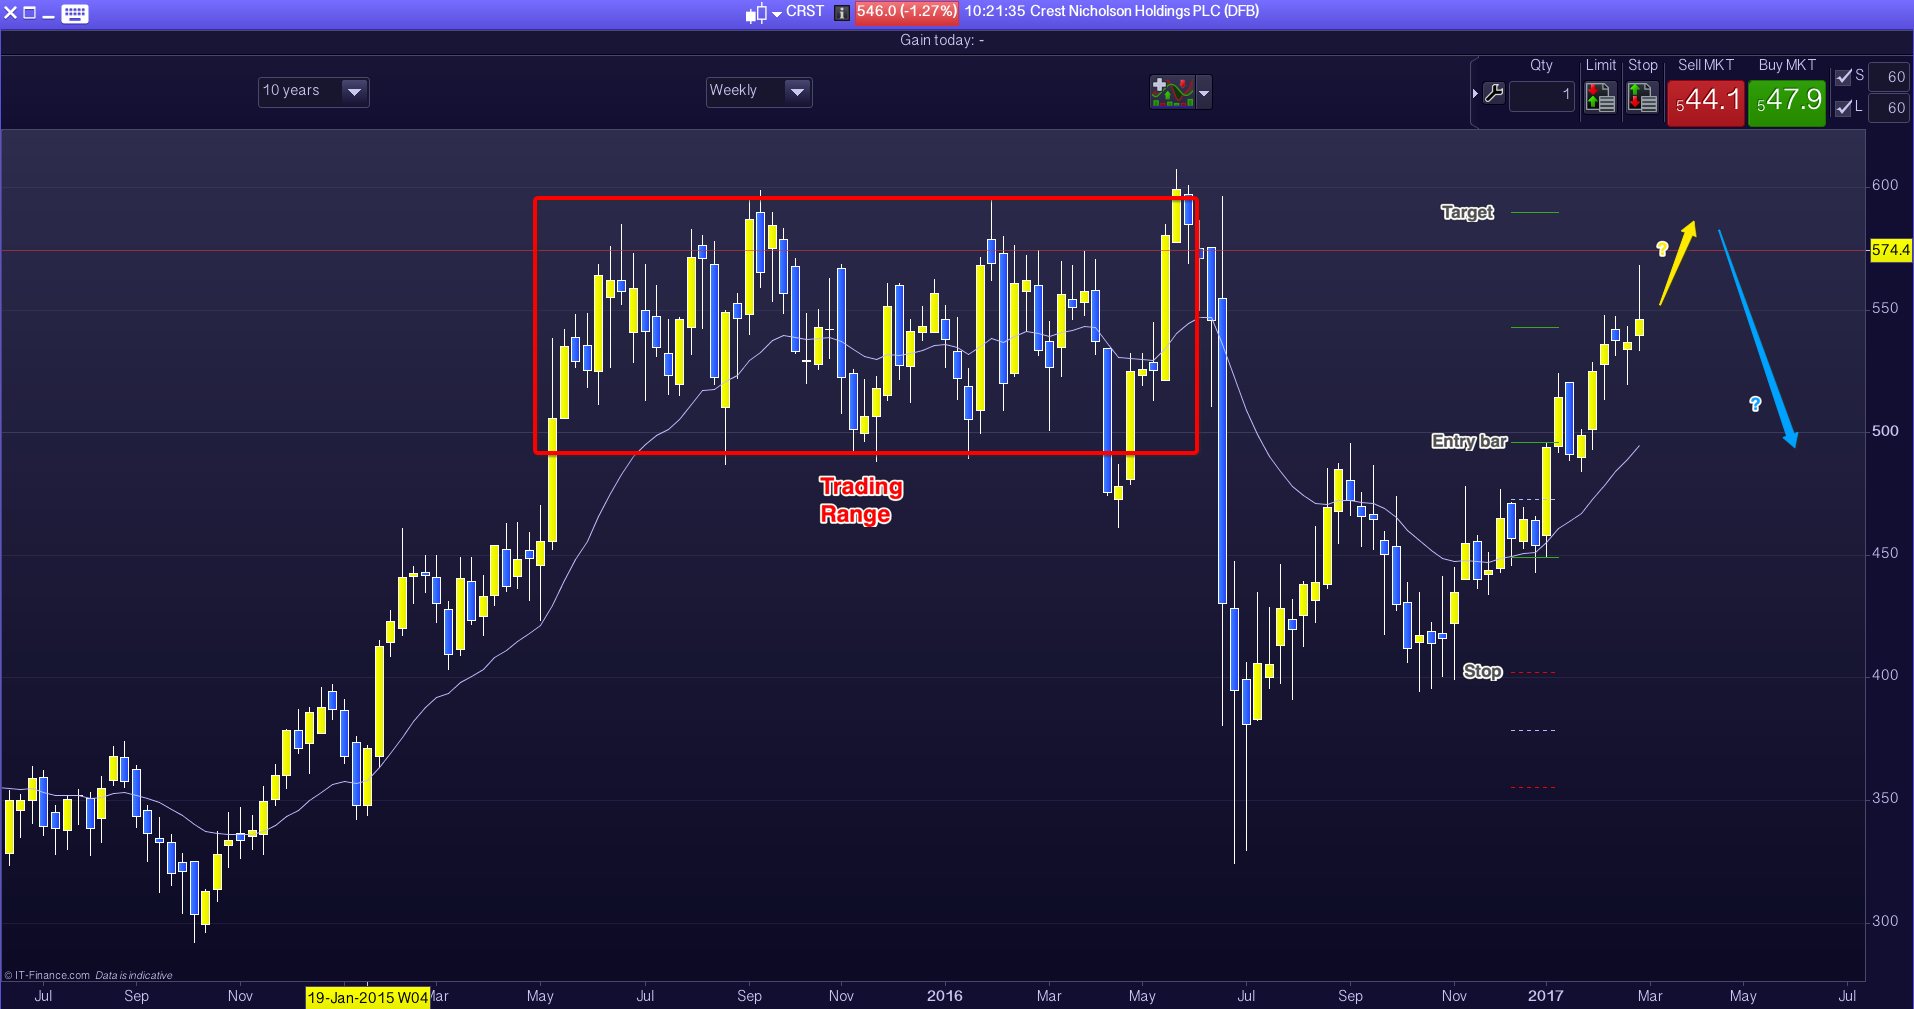
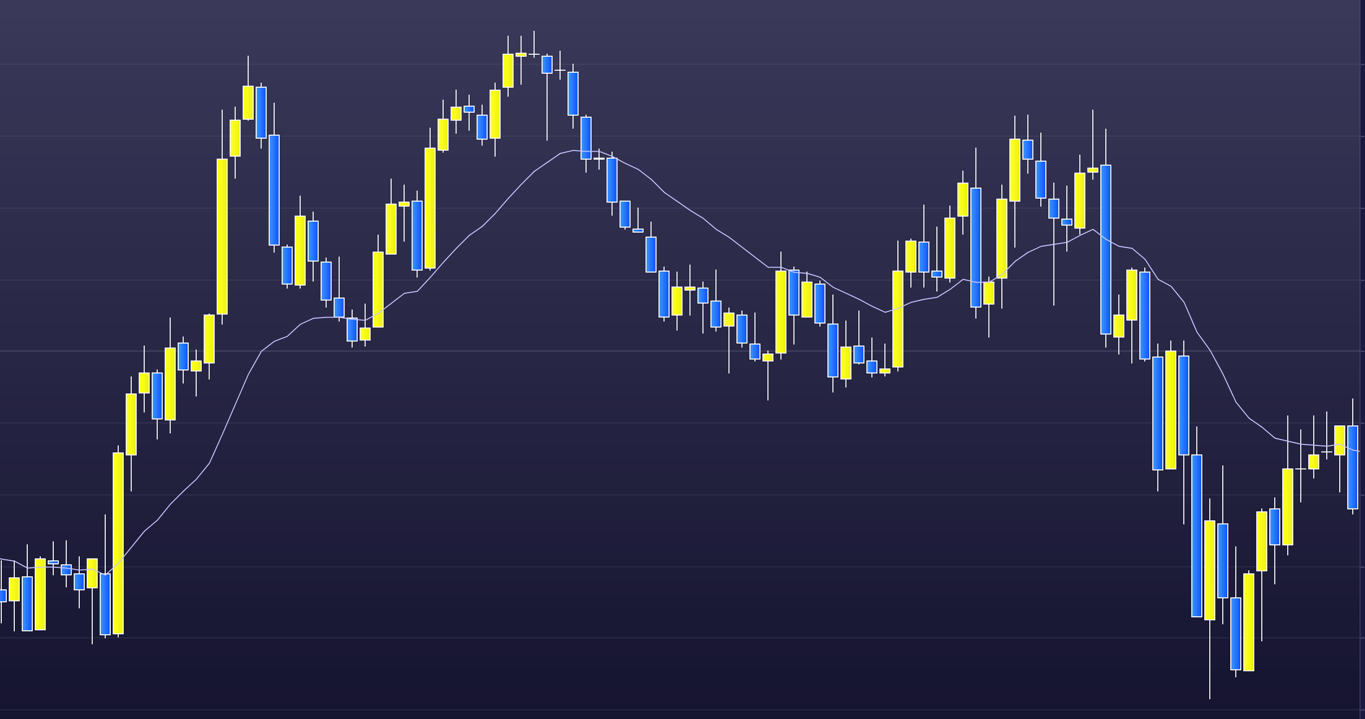
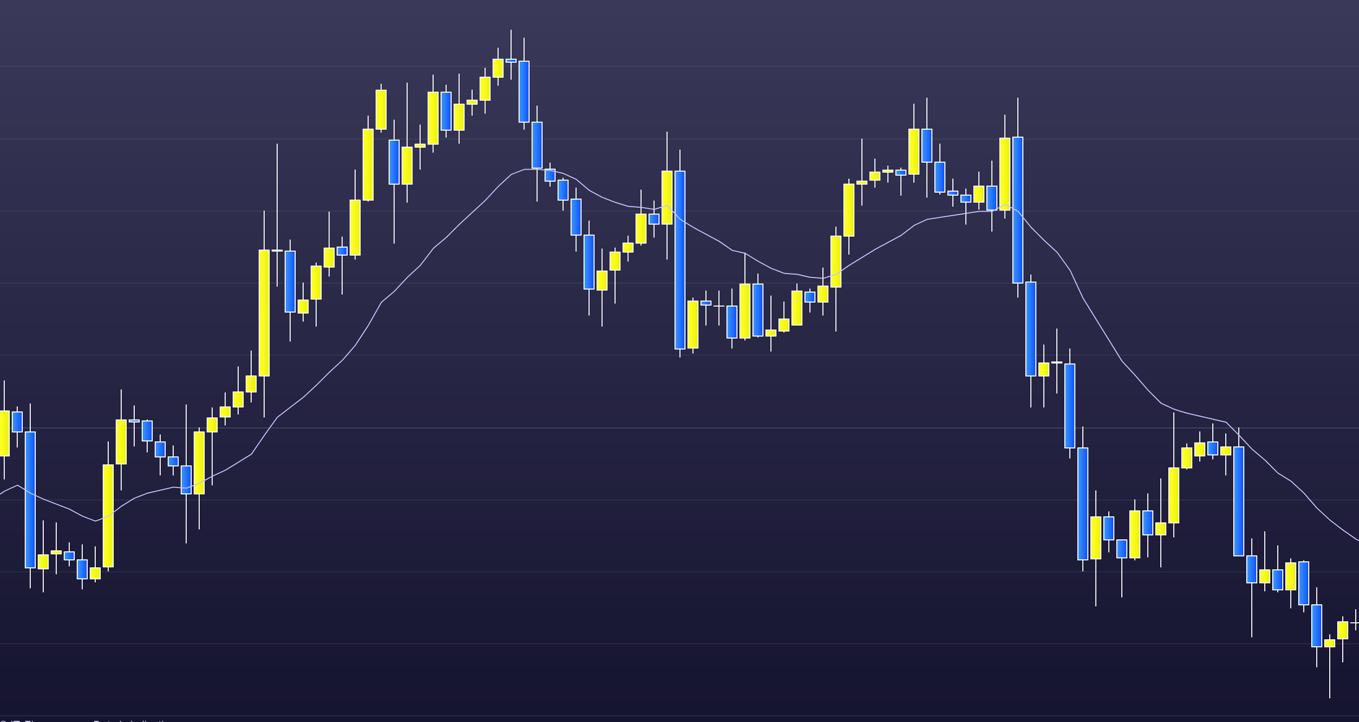
    Therefore, for the shorter term stuff, the technical trading, trading from charts, is it realistic to expect it to work. Without any doubt at all, I can say technical trading works. But we have to know how to tap into it. Anyone wanting the secret, so they can immediately adapt it, are going to be disappointed. Because, I think, the first thing for any trader is that they have to do the work first. They have to learn the ropes. And, I guess, it doesn’t matter which ropes we learn as long as it works for us and we fully understand it. Personally, again having gone the long way round and tried almost every technical method going and failed at each one, I’ve settled on technical trading by ‘price action’.

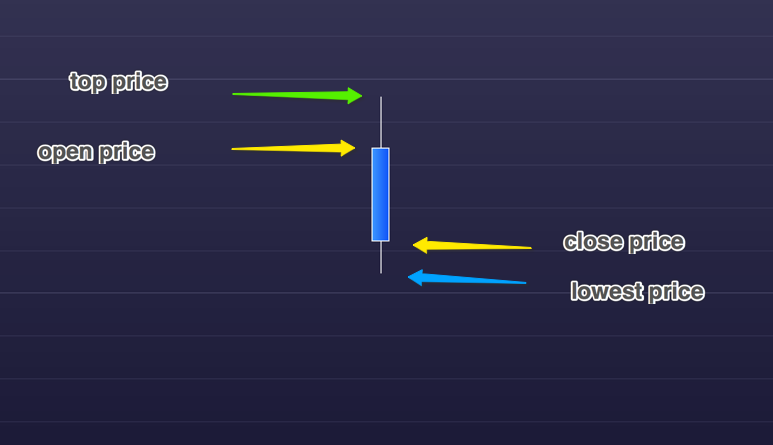
    This sounds fancy but couldn’t be simpler. It involves basic charts only. No indicators to speak off and a couple of basic drawing tools. If you can read music or play chess to the ‘grand master’ level you will appreciate where I’m coming from when I say that it is possible to read the flow of things.

    How long does it take to become a price action ‘grand master’? All I know is that it took me several years, but I’ve worked with someone recently that grasped it to a high degree within a few months. Price action, however, is only one part. Probably the more important part, and this goes for any style of trading, is the management of a trade. Learning that is a different ‘kettle of fish’. That is because it involves controlling emotion. That comes with experience and trading maturity.

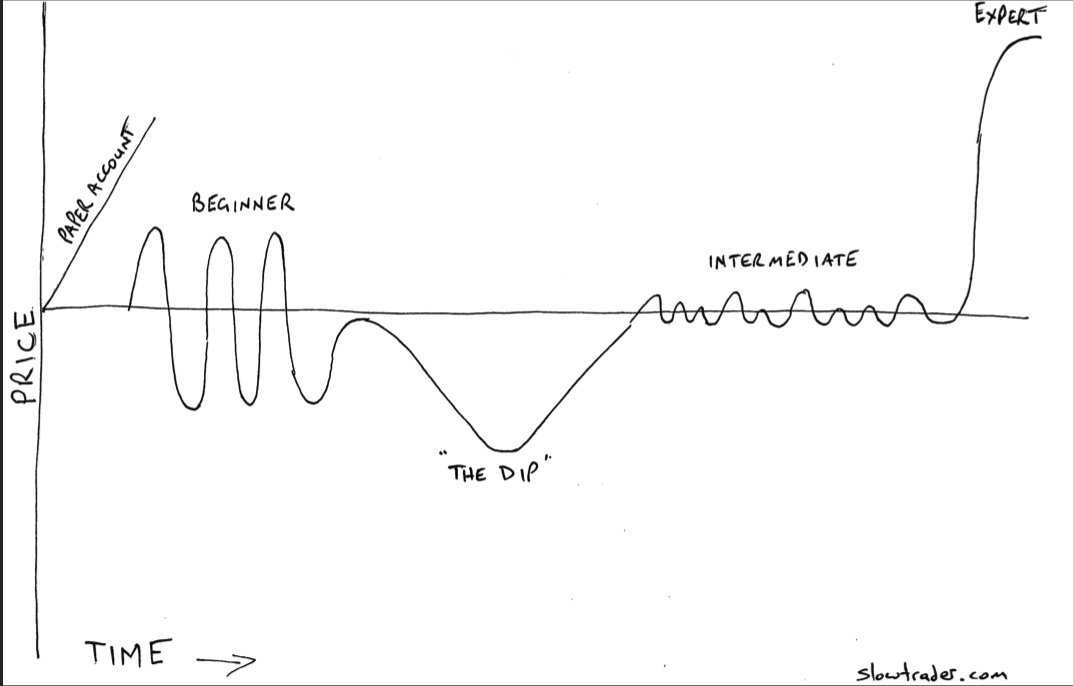
    However, once all this is grasped to a very high degree the ambitious trader will not be pleased to know that it is not enough. It comes up short. After all that, a trader will still, over a period of time, lose money. And it is at this point that traders, having persevered for so long and having invested so much in trading losses, time and emotion – give up.

    To become a consistently profitable trader we have to go through all the learning lessons and then press on through the ‘gap’ to find our edge. And that, dear reader, is the secret. We have to find an edge. What is the edge? It is personal to each trader. The point to grasp, however, is that we do the work first, we learn the trading ropes in whichever trading method undoubtedly suits us. Once we get to that point we all have to go through the ‘gap’ and discover our own edge.

    An edge can, for some traders, be their ability to anticipate trade direction with short-term news. For others it may be slightly longer term trading but only trading a specific set-up or cycle. Even high frequency trading, mostly done through computer algorithms, can be seen as an edge. I cannot stress this enough however – we will not make money trading without an edge.

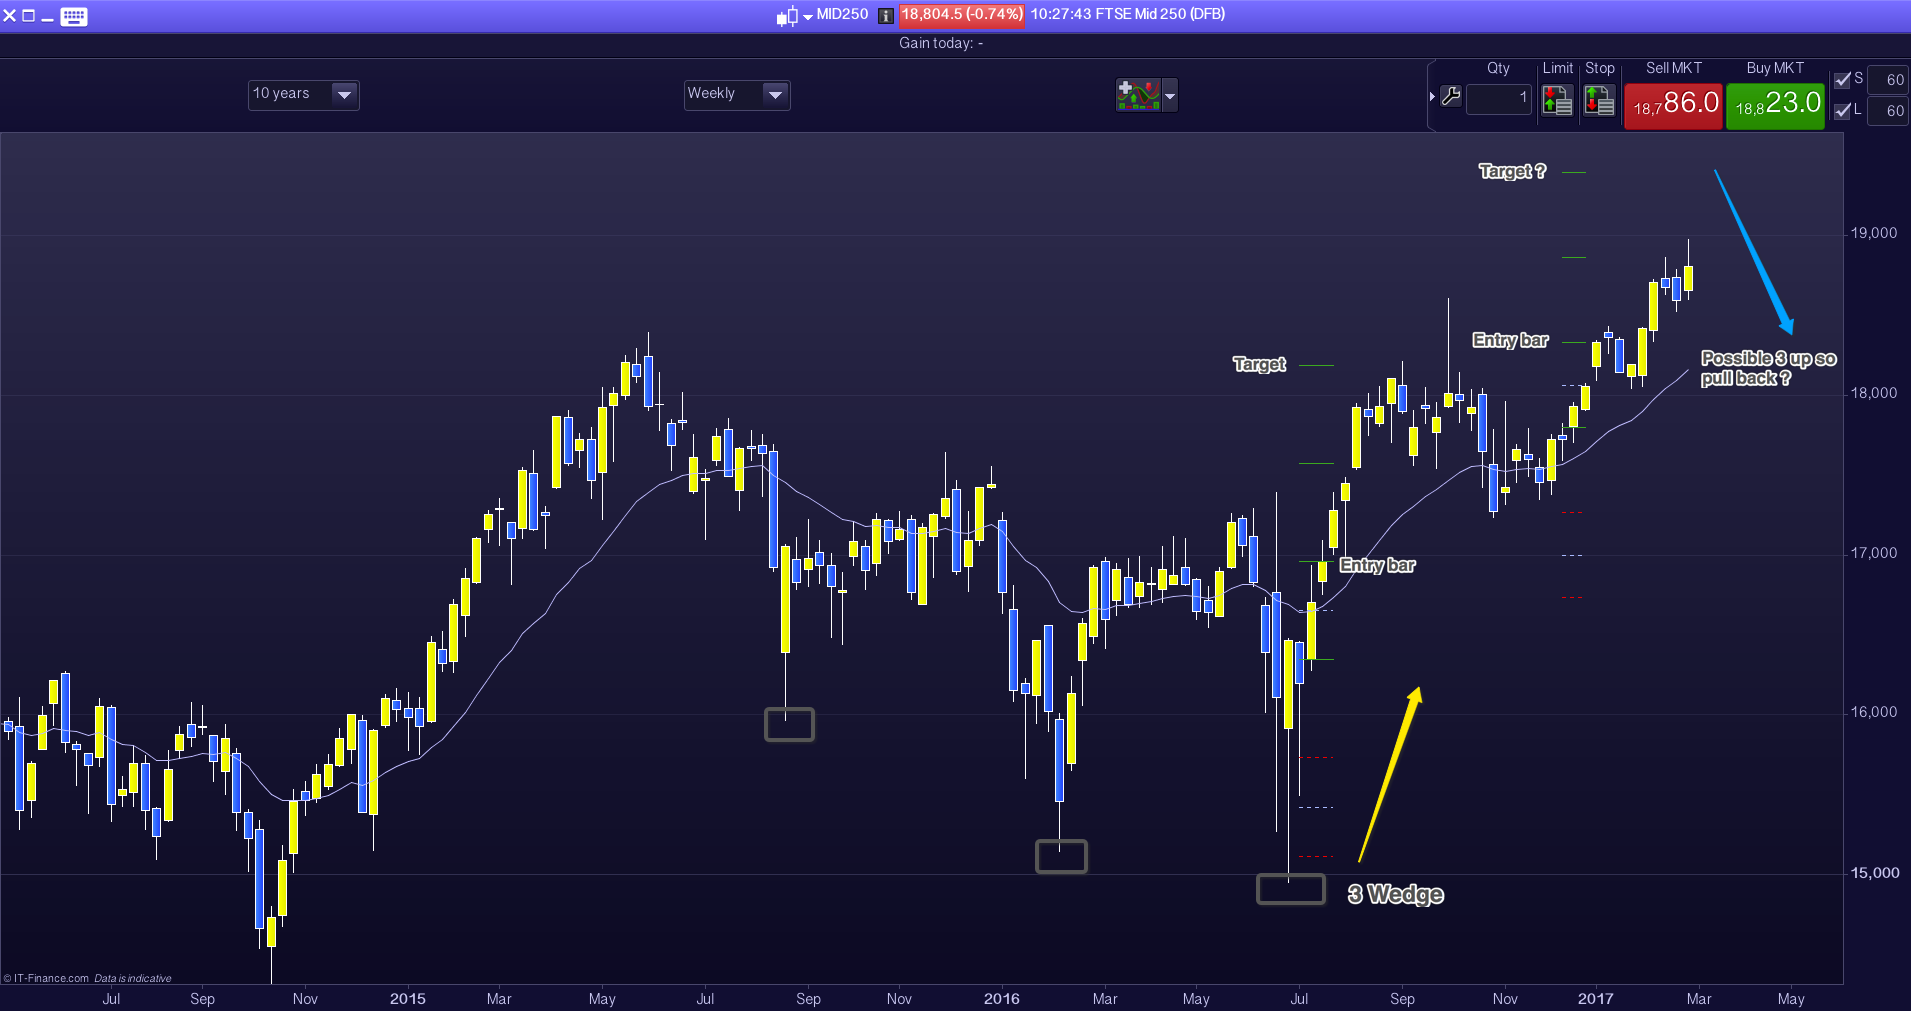
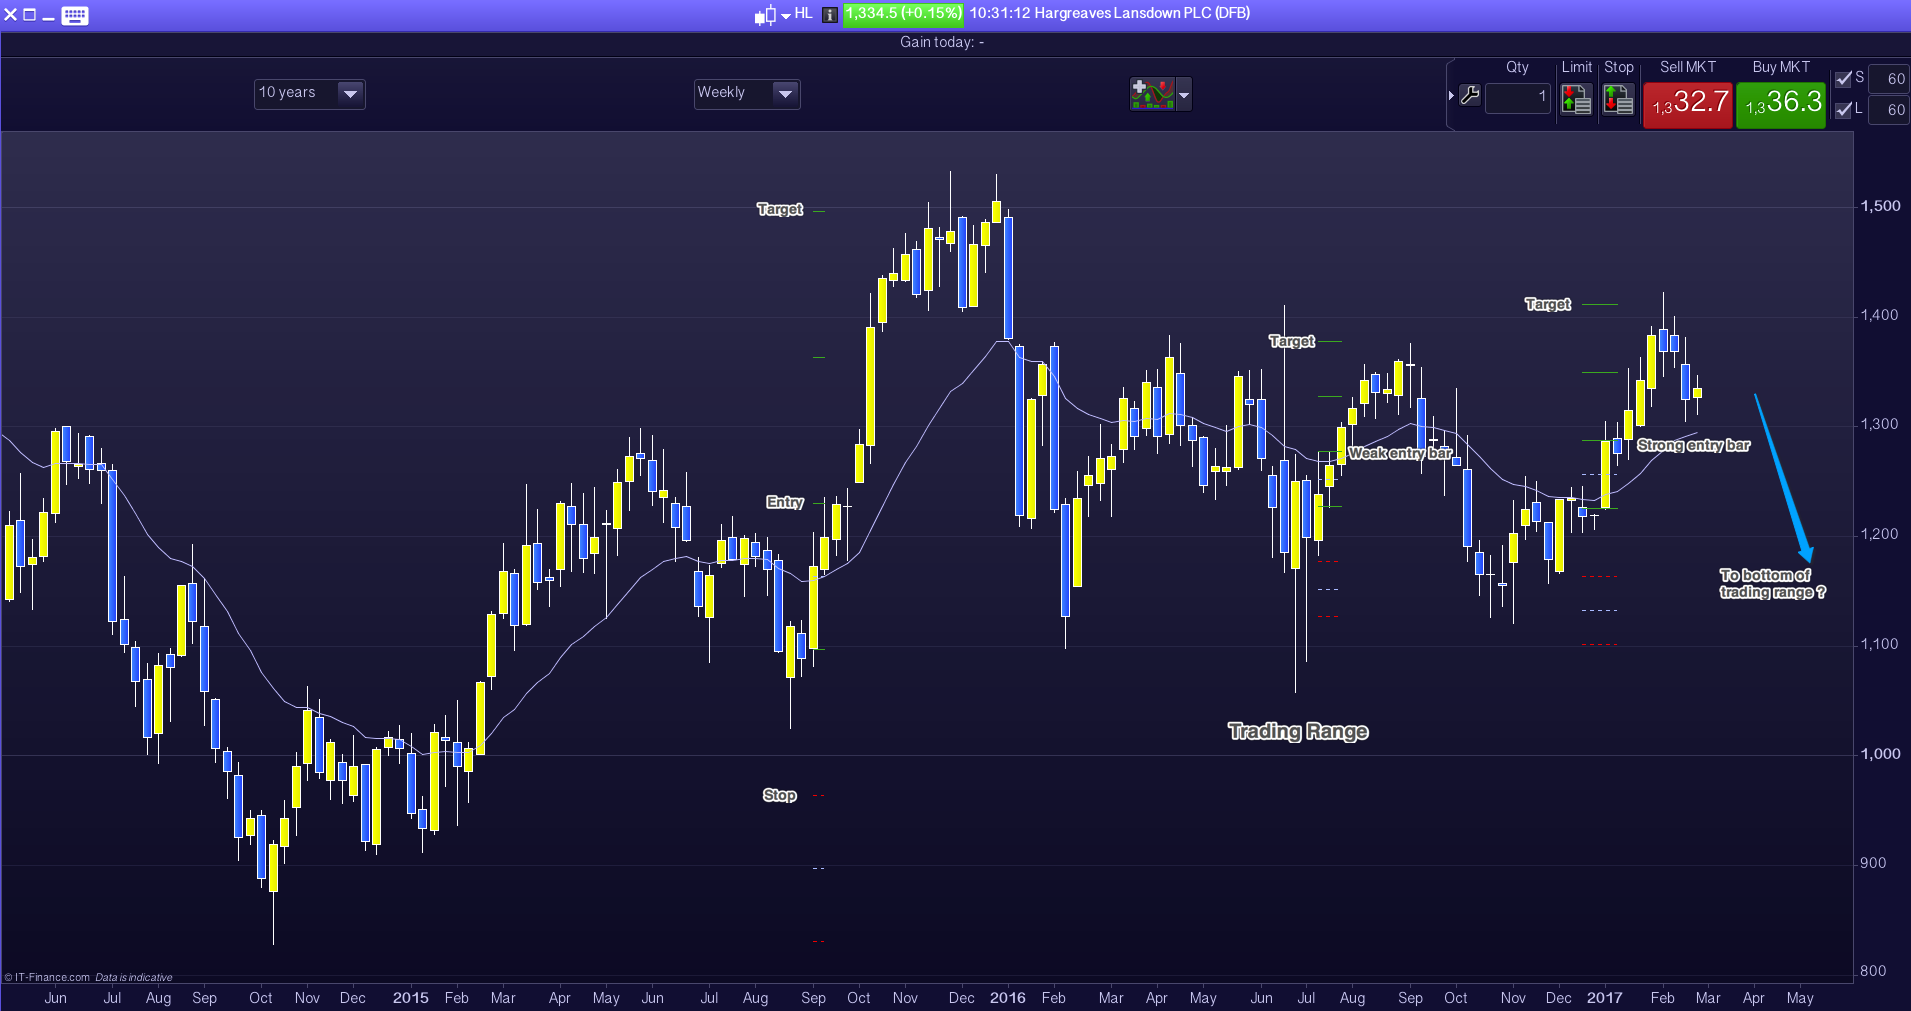
    My own edge, I’ve quite recently come to realise, is the ability to measure risk, reward and probability to a very accurate level. The effect this has had on my trading ambition going forward we will discuss next time.

  • Does trading depend on luck?

    Are trading results based on luck? This is asked now and again.

    Another way to look at the question is the comparison with betting on a horse. We can relate to this as most of us have had a day at the races at some time or other. When we bet we probably fall into three groups:

    (1) We choose which horse based on the jacket colour of the horse or jockey, or we like the name of the horse, or it features in the race with our lucky number.

    (2) We choose based on the form we read online or in the newspaper, we follow the herd.

    (3) We are a professional, we track the methods and results of many trainers and have done so for several years. We’ve databased the form of all the horses running since day one. From this detail we have a 65% to 75% success rate.

    Even with the last example, to have an isolated win is, well, lucky. But out of, say, one hundred bets and winning more than 64 of them has very little to do with luck.

    Next week I will talk about what I’ve found to be the secret to being a profitable price action trader, and no it ain’t luck.

  • Which chart should we use?

    We talk about charts, but what’s the difference between say a 5-minute and a 4-hour chart?

    One of the charts below is a 5-minute and the other a 4-hour chart. Which is which?

    snip20170121_1

    snip20170121_2

    The top chart is the 5-minute and the bottom the 4-hour, I think?

    The point is, charts are like the very large, the universe, and the very small, the atomic level, where there are (apparently) as many details in each.

    Each chart that we use is made up from these fellas. The candlestick.

    snip20170121_5

    We use candlesticks, but there are several ways to show price. On a 5-minute chart the time between the open to the close of the bar is, of course, 5 minutes.

    Different bar colours show a rising or a falling bar. We’ve gone for the colours above as it seems less straining on the eye.

    Many starting out choose lower timeframe charts. Five minutes or less. Lower time frame charts are seen by traders as quick reward for little risk – a protective stop can be placed only a few pips away. When their account decreases (which invariably it does) they then consider only risk. Both techniques are wrong.

    The problem with starting out on the lower time frame chart is that we are competing with ‘grand masters’ with only a few seconds to make a decision.

    The one-minute chart is where most traders are foolishly drawn. In comparison the 5-minute chart seems positively pedestrian. Except that the 5-minute candlestick above often closes with a very different form in the final seconds of its life. Not easy.

    On the other hand, higher time frame charts are not as concerned by the regular pitches in the market due to short-term news and give us time to consider: the all important context (all the bars to the left), possible set-ups and – what the shape of the closing bar is telling us – the price action.


  • Fish and chips or a’ la carte?

    If our restaurant served fish and chips one week and a’ la carte the next, both set of customers are going to be disappointed at some point.

    As with what we serve at the restaurant (within reason) we have to be clear in what we represent in trading.

    Most of our Slow Trader contributors are slightly north of 60. Okay, all except you SA. But you’re close enough for it not to matter.

    Therefore, you’re looking for the fund to do something interesting within the 3 to 7 year period. The younger readers, those under 45, can opt for our share ISA idea, a 20 to 30 year investment.

    These are the two options we’ve blogged about. (1) a dynamic fund that uses lower time frame charts; and (2) a long-term ISA investment based mostly on fundamentals.

    We like the short-term and the very long-term. We don’t like what 99% of the investment market are using, the medium term investment idea. For the long-term investors they expect to go through a few market crashes. Its part of the game. The long-term investors look at this as an opportunity to buy more at lower prices. The Slow Trader is a type of hedge fund that trades both long and short. The fund rides the wave whether it’s going up or down. Everything else in a market crash, the 99% of the investment market, gets stuck in no man’s land with a significantly reduced portfolio.

    For the Slow Trader fund we’ve had some glaring blunders and some moments of brilliance. We’ve benefitted from taking the time to trade the 5-minute charts over the last year, as the lessons from this were vital. However, we’re delighted with the early results from trading 4-hour charts.

    We’ve traded shares from the daily charts but were significantly more successful coming back to the 4-hour charts. Therefore, we now trade a selected mix of currency pairings (FX), commodities and FTSE shares using 4-hour charts.

    We have three trading opportunities a day 8am, 12pm and 4pm. (8pm is a consideration for the FX and commodities-the share market is closed at this time-but as the market goes into night it generally has little movement). With the 4-hour charts we can trade many more markets than is possible with a lower timeframe chart, and we are more likely to benefit from an extended trend.

    Notice the trade amounts in the “how much do we risk” page for 4-hour charts. This is not a gimmick. We trade with a close eye on this page. For the time being however we are trading in the lower amounts per pip/tick and will graduate up to full trading potential (at risk in the thousands) within a few months. It is startling how the fund can grow when we get it right, getting it wrong is not an option – hence the start with the new charts at the lower risk amounts.

  • Long-term buys

    For those that can save for 20 to 30 years consider this pension idea. Based around a UK ISA and investing in companies within the FTSE 350.

    It’s an idea developed around Benjamin Graham’s (Warren Buffett’s mentor) principles of intrinsic value.

    We take 10-years of annual results and determine key numbers of consistency of growth, growth rate and present value as a percentage of value projected: i.e. is our chosen company a bargain?

    Here’s a snapshot of some figures a few years back.

    snip20170107_1

    This analysis is for the long view. The figures are a vital starting point but does not take into consideration the longevity of the company nor the ability of those managing the company.

    That is why we should only invest in companies that we understand, or are prepared to do the work to understand. For example, Blackberry scored highly on the above figures, right up until it fell off a ‘technological’ cliff.

    That means, even with the figures, it is important that we do our due diligence and are happy that a company has legs.

    Similarly, and often subjective, motivation and reimbursement of the individuals responsible for driving a company forward helps our decision to buy.

    But having said that, thanks to Nick, the hard stuff, the figures, will be provided here soon.

    We also intend to provide a ‘price action’ analysis from long-term charts to help with buy decisions.

    Finally, those looking for a home for a stocks & shares ISA we thought that Charles Stanley Direct came out well. Their charges are some of the lowest and all seems clear and easy to follow. Unlike many ISA providers we found.

  • The short the medium and the long

    What is new for 2017?

    Firstly, for my day trading from 5-minute charts I’ve chosen:

    EUR/USD  AUD/USD  GBP/JPY  GBP/USD and Gold

    I trade these most days (half day Friday) from 8am to 6pm. With an hour or two off here and there for good behaviour. I will report day trading ideas from time to time through this weekly blog.

    Secondly, for the ‘slow Trader fund’ from daily charts I’ve chosen:

    The UK top 200 shares

    This was after reflection over the holiday period. Trading currency pairings on a higher term chart, when probably taking the opposite view on a lower term chart, is difficult. Therefore, we needed a home for the fund and the UK top 200 shares fits the bill. Why not US stocks? There is a change in tax on US stocks and also we consider that later this year a large move in the dollar is likely. There is enough going on trying to pick share direction – we don’t need to have to factor in major currency changes too.

    I’m excited about this move of the fund. We will trade both long and short based on ‘price action’ technical analysis. It will provide stability and the increase that we’re looking for. I review all qualifying shares every trading day morning. Entries are based on daily charts, however, best entries may be found on lower time frame charts. Ideally we are looking for entries to last a few days out to a maximum of a few weeks.

    I’ve chosen a selection of the top 200 shares that have what I’m looking for in terms of price, liquidity and stability. I will blog the complete list later and keep members updated of results through this blog.

    Finally, we also want to provide information for the best UK pension ever. That is long-term (many years) investment via a UK share ISA.

    This is a reintroduction to Slow Trader of fundamental analysis. Nick has kindly agreed to provide regular information from his spreadsheet on which UK shares are great performers and available at the right price. Nick will be reviewing the FTSE 350 (that is the FTSE 100 and 250 combined) and I will keep you updated from this list. I won’t provide a description of companies, as I’ve done before, but simply the essentials from the spreadsheet. These are for long only consideration.

    This is all about the fundamentals and the incredible analysis tool that Nick has created. However, James and I will add our long-term (weekly and monthly chart) technical slant. More of this soon.


  • A bigger list needs a higher timeframe

    Traded on behalf of friends and family, the ‘slow trader’ fund has taken on a few changes over its time. We have achieved a gain of over 15% a year, reasonable but short of my ambition for the fund. Over 30% a year is acceptable. We had ventured into equities, taken on the commodities and, more recently, we mixed with the currency markets. Yet, what is more important is the system by which we trade. That is the area that has seen the biggest change. And rightly so, these things don’t develop overnight. Therefore it’s not so much the ‘what’ but more about the ‘how’. The how is already in our ‘how we trade’ page. This page gives a glimpse only and is meaningless to anyone that is not a price action trader, and even ‘they’ differ wildly in approach. It is understanding charts through context, set-ups and price action. And it works.

    My own trading time has been delayed over the last 12 months as James and I traded very small for many hours a day learning the ropes of this form of trading. Pop-in a major renovation of our family business and, well no excuses, but time goes. Moreover, I trade three accounts. A small account for grandchildren, a payment account and the slow trader fund. I trade the grand kids account at the beginning of the month until I achieve the return I’m after and then do the same with the payment account. Only then do I move onto the fund. This may or may not leave much of the month left for the fund. This is not making best use of our trading time. Being only so many trading hours in the day.  The best way to provide more trading time for the fund is to trade a higher timeframe. Obvious, but I didn’t want the distraction of this as I was developing and remodeling my price action system.

    Currently we trade a 5-minute chart and on one item. This provides several trades a day on average. I scale-in on some of the trades which increases entries but, nonetheless, is essentially within the umbrella of one trade. If we trade the fund on a higher time frame – a daily chart being our most sensible option – then we will need more items to trade. Price action can trade anything. Using daily charts our in-trade duration would be a few days to the extreme of a few weeks. Equities would require the consideration of annual results and other business calendar events. I’m therefore favouring a commodity, S&P and currency trading list. As follows:

    snip20161214_2

    These provide us with enough items to give ample trading opportunities from a daily perspective. More importantly, through this higher chart we are not jostling for trading time with the other accounts. Our risk, probability and reward criteria will not change. I think we are ready for this, and look forward to its introduction at the start of the New Year, 2017.

    Merry Christmas and a happy (which for us means prosperous) New Year

  • Trade with broad shoulders

    I’ve enjoyed the England rugby these last few Saturdays. Who wouldn’t.

    Anyone watching the last couple of games may have noticed a debriefing tool the commentators have to show the game line. The TV tool puts a coloured band across the whole pitch showing a colour for gaining ground and a colour for losing ground.

    As in trading, and even as the more powerful winning team, we have to be comfortable with giving ground back. Often all of it. It’s part of the game. We have to trade with broad shoulders.

    A weak trader will panic and, to use our metaphor one more time, kick the ball into touch for the silliest of reasons.

    A contribution to this, and a mistake, is trading above our ‘I don’t care’ or  comfort level. See our new page ‘price per pip’ for our interpretation of how much to trade per pip depending on account size and stop position – which is risk.

    We’ve also made changes to our ‘how we trade’ page which we refer daily. Every trader should first write out a defining ‘how to’ page for themselves. We knew this, but learnt the importance of it the harder way.