Lightspeed will implement updated Pattern Day Trading (PDT) rules on 4 June.
For me, it is not so much the 4x leverage, but the intraday rather than next-day share renewal that makes a significant difference for day traders.
Lightspeed is offering 4x leverage on accounts with an initial balance of at least $5,000, which they call margin 2. However, not all stocks are suitable for full leverage; suitability depends on their risk and volatility.
Many low float stocks fall into this category and are often not available with full or even partial leverage.
The other, and my preferred option with Lightspeed, using the same account size, is called Margin 1. This option does not provide leverage, but like Margin 2, it allows intraday recycling of shares traded, meaning your buying power is immediately restored after closing a trade, so you can use those funds for additional trades on the same day.
(With OTC accounts, funds are also returned immediately after closing a position. However, OTC accounts are decentralised and don’t offer reliable market depth or Level 2 information.)
Equities and futures provide usable Level 2, or “tape,” and depth-of-market displays, respectively.
I have chosen to day trade low float equities, which are generally low-CAP NYSE-listed shares.
Before 4 June 2026, the significant disadvantage of trading NYSE equities was the next-day settlement, particularly for a lower-funded account.
These new PDT rules create significant opportunities for profitable traders, as more trades can be made in a session if opportunities arise.
My thought process is: get in, get green, get out.
Get in:
The first thing I notice is an appropriate stock coming up on my scanner. A scanner is software that searches for stocks based on predefined momentum criteria, such as relative high volume (number of shares traded), price, and price movement (how quickly and strongly the price is changing).
Within the scanner, I check the float, which is the total number of shares available for public trading, along with the day’s volume (the number of shares traded so far today).
If these numbers look good, I check the ‘about’ page (company description). Then I check for any recent news catalyst—a major event or announcement that could significantly affect the stock price.
I then glance at the ownership section, which shows who owns the company’s shares and their stake size, to see how it is distributed among investors.
If all looks good, I enter the ticker symbol (the stock’s unique identification code) to open the tape. The tape displays Level 2 (real-time order book with bids and asks) and Time & Sales (a list of every actual trade as it happens).
Volatility—the degree and speed of price movement—can also be measured from time-and-sales data, which records every completed trade, including price (trade value) and size (number of shares per trade).
Next, I scan the chart for price action, trading volume, RSI oversold signals, and the price’s position relative to the 50- and 200-day simple moving averages. RSI shows momentum by comparing gains and losses. Moving averages indicate the average closing price over 50 or 200 days.
I then review the chart’s timeframes—specific periods displayed, such as 1-minute, 5-minute and 4-hour views—to learn about recent and historical price movements. I also mark key resistance levels, which are price points where the stock has had trouble moving higher in the past, before proceeding.
Get green:
Around 30 seconds in, if it’s an in-play stock (one with high volume and interest) and IWM sentiment is positive, I start looking for a buy setup (a trade entry opportunity).
Finding a setup, which means identifying a favourable condition to make a trade depending on what’s happening in the market, may be instant, take an hour, or never come.
A setup is a trade opportunity identified by analysing both the stock chart and the tape. Once buying starts, my focus shifts mainly to reading the tape to gauge the activity and strength of buyers and sellers.
Get out:
While the chart often provides a potential sell price by indicating patterns and key levels, my exit decision is ultimately based on reading the tape—watching real-time trades and orders for signals that the stock price may reverse direction.
The Russell 2000 (IWM) is a good gauge of market sentiment for small-cap, low-float stocks. Last month’s post noted that the IWM was below its 200-day average; yesterday, it moved to a new high. Quite a recovery.
During that same period, a few excellent low float stock opportunities emerged in the pre-market.
I managed to trade some, missed others entirely, and on a few, only caught a small slice of a bigger move.
At times, I held off buying for too long because the stock’s price was too close to a moving average or a significant prior high, which ultimately didn’t hold.
Additionally, there were one or two stocks with ownership structures that made me wary—on one occasion, if I had acted, it would have been the trade of the day.
Every day, I record specific lessons in my trading journal for each trade, such as whether a setup is reactive, my focus, and whether I’m reacting decisively to breakouts and recognising setups that fit my strategy.
Looking back over this period, trading was not as easy as the IWM index chart would suggest.
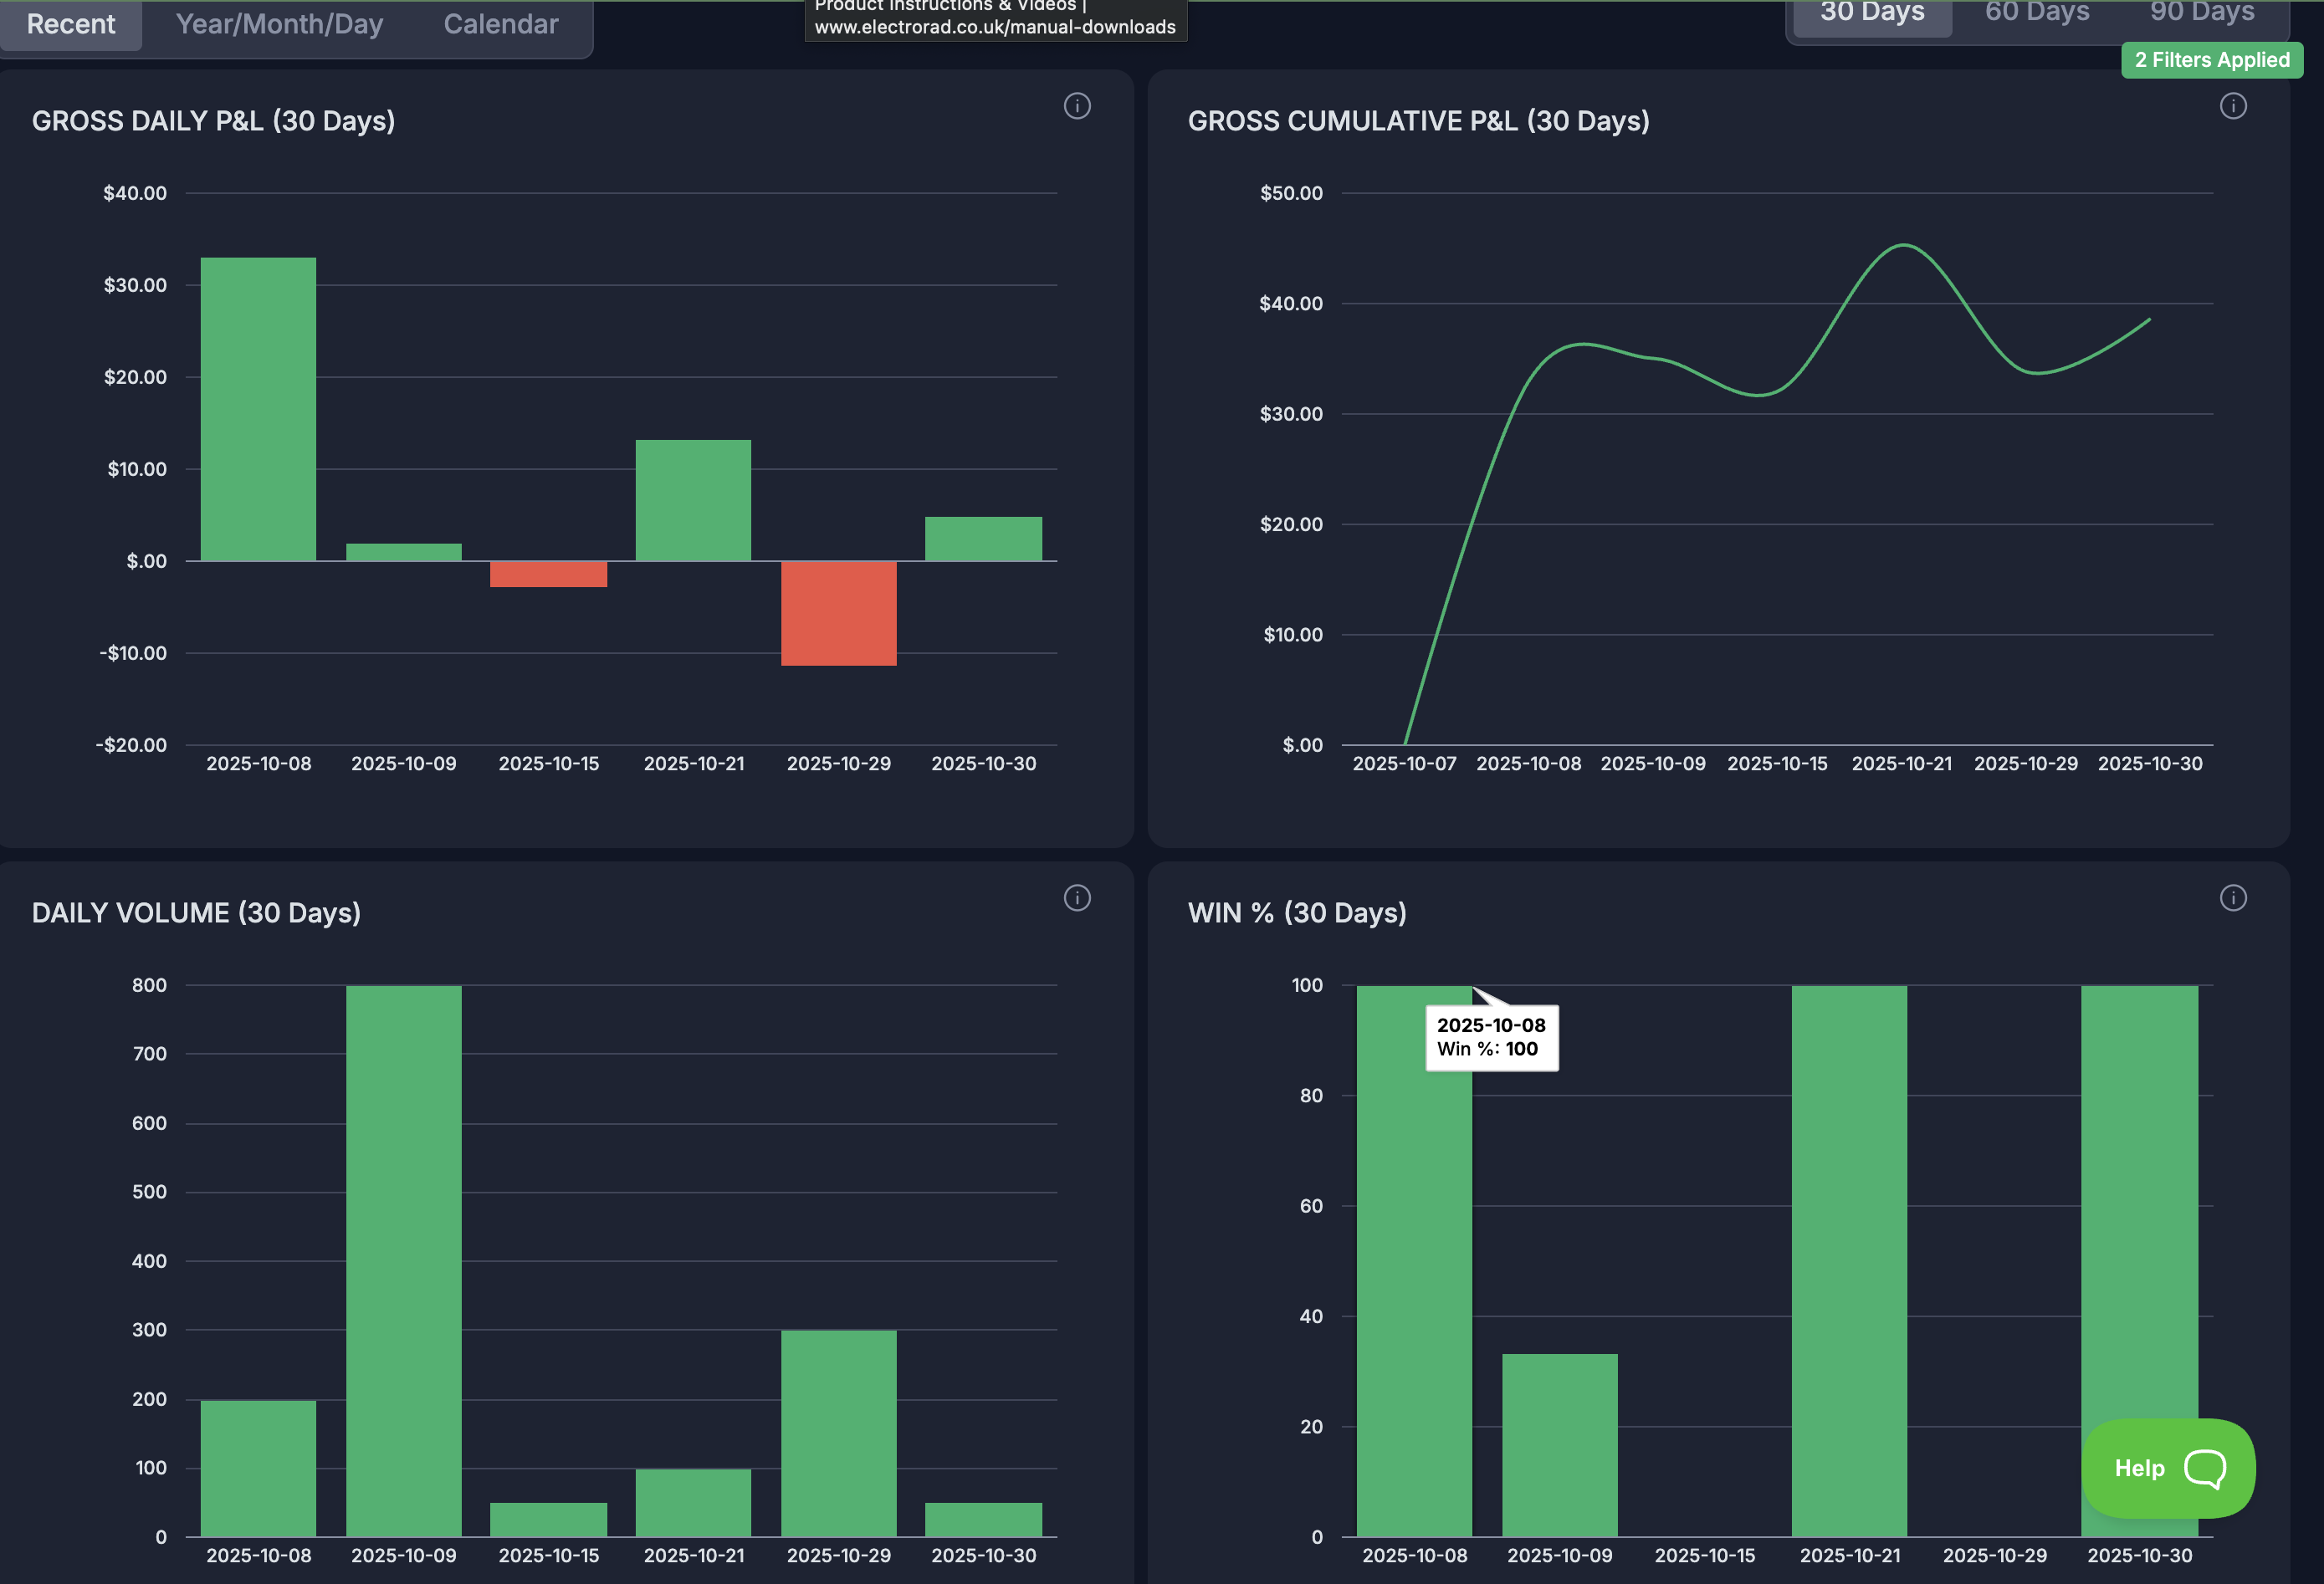
Nevertheless, I have incurred only a few small losses during this period, and over the last several days, my trades have been 100% winners—not too big a boast, as our account is still too small to take more than one or two trades per day.
So, I continue to wait for a setup I can fully commit to—an excellent way to trade. Even so, I have occasionally entered trades too late, which I’m now tracking and working to improve.
Looking ahead, a change to the Pattern Day Trading (PDT) rules will be a positive development for me and for those who have started small and are self-controlled, profitable traders.
The rule change is now in transition. With the change, as long as an account is above $2,000 (down from the current $25,000), it could qualify for PDT and would not be subject to a fixed capital trading requirement.
With this adjustment, small accounts can use margin or leverage to make multiple-day trades. Of course, this is great if the trader is profitable, but not so good if they are not.
Although already approved, this new PDT rule will likely not take effect with brokers until later in the year.
Why be a reactive day trader in uncertain times? Because I thrive on it.
This is when experience as a reactive day trader really shines.
Even though my trades last only minutes, understanding the bigger picture is always beneficial.
To help keep perspective, I recommend Mohamed A. El-Erian’s free Substack for a regular global overview. Each week, he reviews the broader economy and markets.
Since I trade low float U.S. stocks, I also track major indices like the S&P and monitor IWM in real time, typically on 4-hour and 15-minute charts. IWM covers about 2,000 small-cap U.S. companies.
I also consider stock fundamentals, such as float size relative to daily volume. But mismatches aren’t always red flags; market context and news matter for interpreting float and volume.
Ownership structure is a go/no-go. I prefer mostly private shares. If a large institutional or single-name presence exists, I usually avoid the trade.
For companies with unclear ownership, I only trade after thorough research.
A company’s work influences me, but this bias isn’t always reliable—I have favourites like biotech, pharma, and AI.
Still, I assess most opportunities that hit my scanner.
I consider a company’s location, though I try not to. If I trade a more exotic name, it’s later in the move, with smaller size and shorter hold.
I now track my location caution in my Tradervue journal to gauge if it’s justified.
Market sentiment matters. Recently, the IWM hovered near its 200-day moving average, dipped, and retested. For me, that signals scalp-only trades.
I act reactively: enter as a stock climbs, exit when momentum weakens—before any pullback.
The market may be bullish, but it is fickle. Few stocks see persistent buying. All we can do is show up daily and wait for the right trades.
Not really the trading period I was looking for to progress my twelve-month trading challenge. A couple of weeks after my last post, I didn’t record any trades. I turned up every day, but just watched and waited. Such a cold market. No opportunities for me. Probably opportunities for the larger fund, but even those, I suspect, would have been weak and fleeting.
Some improvement, however, as we entered March. When I say ‘improvement,’ a few stocks in early March showed strong momentum. VCIG, a consultancy firm, was one. There were also a couple of Biotech and Pharma stocks, which remain my preferred low float opportunities. Other than that, Artificial Intelligence stocks moved occasionally. More recently, energy and defence stocks have moved, albeit irregularly.
Previously, many stocks would have bounced significantly, but at the moment, I’m happy with a few cents of positive movement. This change in my expectations stems from the extended periods of waiting—weeks in February and days in March before a trade opportunity appears.
These waiting times can leave me open to mistakes. To mitigate this, recording past trades on the tape (level 2, time and sales) for simulation would be highly beneficial. For example, when a trade popped up recently after days without activity, I entered it manually (rather than using hotkeys or hotbuttons). Still, I didn’t update the inside ask price before hitting the buy button.
The difference was 30 cents higher than the anticipated price. The stock had a particularly low float and a significantly high relative volume. My limit order was executed immediately. Yes, I did manage to get a 70-cent profit. But with better execution, that profit would have been a whole dollar. Multiplied by the shares traded, it’s easy to calculate the difference.
I primarily trade with hot keys tied to the ask price. I choose the ask over the bid, unlike most traders, due to my reactive style. I avoid predictive setups whenever I can. Though I sometimes slip, I’m improving at staying reactive.
Let me explain what I understand as a reactive trade. As Lance Breitstein says, “trade on the right side of the V.” For me, that means whichever timeframe we’re using on a chart, the green bars (long) are winning. This is as opposed to red bars (shorts) winning.
It is always easy to look at a chart in hindsight and, with total confidence, say, “This is the entry.” This perspective often shapes how most YouTube courses and the like sell their methods—it looks so obvious in hindsight. But, in real time, it is not as clear-cut. That’s why it is so important for each of us to find what works for us.
Whether we are good with rapid change, whether we can read signals—be it price action, indicators, or both—and which combination suits us best and how proficient we are at reading the tape. Personally, to ensure I’m being reactive rather than falling into the predictive trap, I primarily use the tape. I check the fundamentals that matter to me, and once I have a suitable reaction on the tape, I check the chart for a worthwhile trade setup. This step-by-step approach helps me stay reactive.
Sometimes a trade entry can follow this simple sequence, especially when the stock is moving so quickly: I glance at the necessary fundamentals, see the tape take off, check the chart for structure, refer back to the tape, and, a moment later, I’ve taken the trade. At this stage, most of my attention is now glued to the tape.
More often than not, the process is slower. In these cases, I mark resistance levels on the chart and examine all necessary timeframes for clues. Then, I wait for the tape. The danger is during this wait, when we try—consciously or subconsciously—to predict price and chart structure.
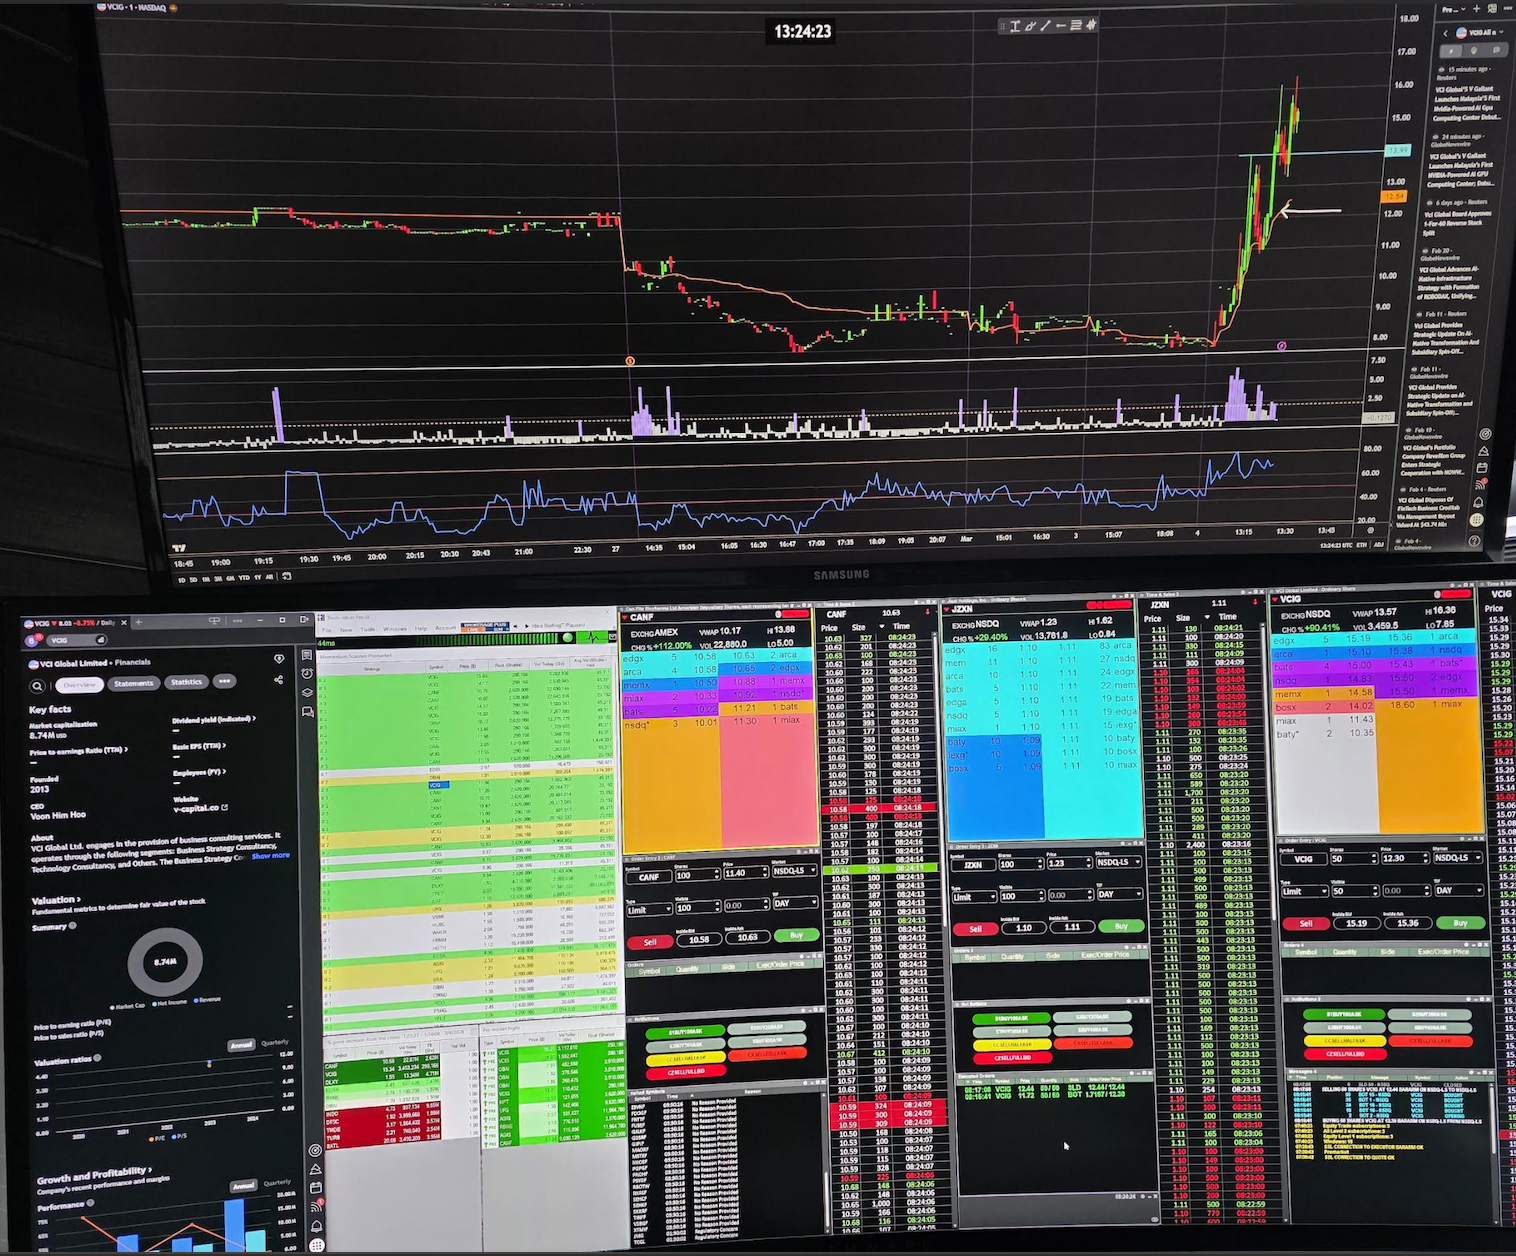
The arrow on the chart above shows an entry. Notice how, for me, the level 2 and time and sales dominate the area rather than the chart itself.
As we begin the new year, I wanted to provide you with an update on my trading strategy and the adjustments I’ve made to my trading screen, which I believe will enhance our efforts moving forward.
Recently, I’ve dedicated time to organising my trading screen to improve my workflow. This organisation enables me to better monitor potential stock opportunities and respond to high-priority trades as they arise. Although I’ve been experimenting with various timeframes, setups, and indicators, the objective is to refine my approach to prioritise ‘A’ list trades.
The adjustments primarily revolve around the Level 2 and tape information, which remain consistent with my previous setup. I have repositioned my information and context charts to the right of the tape, which seems promising. These charts help identify trends across specific timeframes using a single Exponential Moving Average and a Wilder line, enabling a clearer view of market dynamics.
On the left side of Level 2, my primary entry chart is now a 1-minute or 2-minute timeframe. Data from my Tradervue results indicate that these timeframes yield higher success rates than shorter periods, such as the 10- or 15-second charts, which is encouraging and aligns with my overall strategy.
Additionally, I’ve incorporated the Relative Strength Indicator (RSI) with key thresholds at 80 (overbought) and 20 (oversold) to better gauge market conditions. I have found valuable insights from Garrett Drimon of SMB Capital that have reinforced my decision to include this indicator.
To maintain clarity, I keep my charts simple. The entry chart displays only the Average True Range (ATR) and the Volume Weighted Average Price (VWAP) line, avoiding clutter and making decision-making easier.
In sum, as a short-term momentum trader, these enhancements to my trading setup will provide greater clarity on entry points and reinforce our trading strategy. The depth of trends shown to the right of Level 2, coupled with indicators to the left, will aid in identifying optimal setups. VWAP with session anchoring I’ve always included; however, the ATR dynamic stop-loss management is a new approach.
I am trading US stocks through the Lightspeed platform. Although there are commissions to pay with Lightspeed, it is a solid platform, and trades execute immediately, unlike many commission-free sites. As a day trader, the immediacy of trade execution is essential.
October was a relatively slow month. Additionally, I had a project to complete: redesigning an area of the business into a guest gym. However, I still managed to trade for at least half of the month, and took trades on only six of those days.
In my preferred trading range of $2 to $20 per share, movement, apart from one stock that skyrocketed and I missed, has been light.
As I build the fund, starting with only $2,500, I must be cautious that fees do not significantly exceed the profits; this requires me to consider my trading style carefully.
Please note that I am buying and selling actual shares, which differs considerably from leveraged derivative trading. Once I enter a trade, even if I hold it for only a few seconds, the full cash commitment is not available again until the following day, regardless of whether the trade is a win or a loss.
Selectivity in trades is crucial, but so is commitment. Not all trades are equal. Where able, I try to gradually build my commitment to a trade as its suitability becomes clearer—a much more challenging skill than it seems, which is why most of us tend to make a single entry.
Additionally, I try not to overstay my welcome in a trade. I focus on exiting when the trade weakens, but I always look for a re-entry if the market conditions suggest it—a challenging balance to keep.
My results, however, indicate that I tend to exit trades that are likely to maintain momentum too early, which is an area I need to improve.
To that end, I have recently shifted my focus away from price action trading. As someone who has long advocated for this approach, I found myself prioritising candlestick patterns and price movements over the tape.
By “tape,” I mean both level 2 data and time and sales information. By eliminating candlestick charts and instead using exponential moving averages, along with a session volume-weighted average price across several timeframes, I could still identify a justifiable entry signal, while entirely focusing on analysing the tape.
Furthermore, focusing more clearly on the tape has significantly reduced my drawdowns, but it is still early days.
The profit results from last month are inconsequential, but we are prepared to capitalise on any long-only volatility that may emerge.
The lower screen shows three Lightspeed level 2 displays and their associated time and sales. The upper screen displays four charts of the same stock over different time frames, absent the usual bar chart.
All traders look for an edge, an ideal way to enter, manage and exit a trade.
It is crucial that a chosen edge suits us individually too.
The time-critical stress of the day traders world is probably not for everyone. Nor, for others, the weeks or months of being out of the money, as in the longer time frame deals.
However, if we have the time, the knowledge and the inclination we might be comfortable trading in both disciplines.
More than this, one helps to condition the other. In day trading we have learnt the art of the identification of a likely trade. In longer-term trades, we appreciate the need for trade management and a requirement to ignore emotion and the uncanny ability to hit targets when we are not necessarily observing the trade moment to moment.
A big supporter of the commitments of Traders (COT) report, not everyone is as it is infrequent in its signals and notoriously broad in its message. However, with longer bets, as a ‘conditional’ trader, the COT provides arguably the only edge that is not in itself related directly from the price.
Day trading has provided us with skills that can be coupled very well with the longer term charts and this, in conjunction with the COT, offers an exciting way forward.
With additional funds coming in to trade, we looked at what would complement our day trades but not emotionally or otherwise interfere.
Significant commodities and a selection of currencies traded from weekly charts in unison with the COT is our chosen direction.
The margin on spread bet and CFD accounts are about to increase significantly. Why?
Many (and indeed any accountants we’ve spoken to) consider spread betting in the same light as a sports betting app.
They couldn’t be more different. Financial spread bets and CFDs demand a different level of consideration to sports betting. The difference between a CFD (contract for difference) and spread betting – apart from a grown-up name – is in detail.
Beginners ought to start with CFDs as losses are deductible and then move to spread betting once profitable as profits on spread bet accounts are not taxed. Most do it the other way round.
In both the trade is an agreement rather than a purchase of a security. They are traded as a derivative of the market. That is why they can be traded both long and short either as a stand-alone trade or as a hedge.
This sports app miss conception possibly fuels the increase across the board of margins in CFDs and spread bet trades.
Not too long ago margins were calculated at 0.5% of the potential risk, it is mostly now 1% of the risk and soon to increase to 5% of the risk.
If we take the currency pairing of Sterling versus the Dollar the market as we write is at 13,962. To spread bet this at say £10 per pip (a pip, in this case, is the final digit). The risk is 13,962 x £10 = £139,620
Probably not the same as a sports app bet! The margin required to trade at 5% is £6,981. If we consider that a suitable maximum margin of our account at any one time is not more than 10%, then we would require £69,810 to trade. Many serious retail traders trade up to four times this amount.
So, yes the margin increase ought to make many traders reconsider.
Our Slow Trader fund has sat on the fence for a few months waiting for me. Not being a boom and bust trader, I have traded small whilst developing our ‘probability trading’ technique.
A level of profitability through consistency has to be achieved before increasing trade size. The technique provides that, now it is up to me.
It may seem a bit odd that I’ve moved away from trading a market, US stocks, that has increased this year as an index 20 percent or so. UK shares not so much at 6 or 8 percent as an index.
To day-trade profitably I need to give it (day trading) all my attention. Having trades open in other areas and time frames were definitely a distraction for me.
Why have I chosen day trading despite the many stories that tell us not to trade this way? Bizarrely, it is control. As a ‘probability’ trader, we accept that we are trading a market that is random. In other words, we accept that anything can happen.
If we except that anything can happen, then we accept the risk. We accept that the market is only about a price that can go either up or down. In ‘probability trading’ we also accept that certain effects happen when lots of traders trade. Things happen that can give an observant trader an edge.
Despite the simplicity described, it has taken me a couple of years to combine price action trading and money management, specific entry and exit techniques, and group it all together, test it exhaustively and call it probability trading.
Fund contributors that think the share market, and particularly the US stock market, are to continue climbing throughout 2018 ought to withdraw their funds from Slow Trader and head that way.
After all, that is the market, with you, that Slow Trader originally entered.
If you stay in the Slow Trader fund, and to do so you don’t need to do anything else, you become part of a probability day-trader fund. Our advantage: we are not concerned about a good or a bad year for stocks and shares; we trade a currency pairing in the short-term, with an edge; with (to quote Mark Douglas) rigid rules and flexible expectations.
We have developed a day trading strategy that allows us to take money consistently – day in, day out. We scale-up though when we’re ready.
We have been awarded professional client status by our brokerage.
To be classified as a professional client the qualification is 2 out of the following 3 statements below:
Carried out CFD, spread betting or forex, in signicant size, at an average frequency of 10 per quarter over the previous four quarters
An investment portfolio (including cash deposits and financial instruments) exceeding €500,000
Work or have worked in the financial sector for at least one year in a professional position, which requires knowledge of CFDs, spread betting or forex
Why is professional client status a big deal? Because margin requirements will increase substantially for ‘retail traders’; for professional clients they will not.
What is ‘margin’?
It is a good faith deposit that a trader puts up for collateral to hold open a position.
It is not a transaction cost, but a portion of our account equity set aside and allocated as a margin deposit.
When trading with margin the amount of margin needed to hold open a position is determined by trade size. As trade size increases, margin requirement increases.
This has no effect, however, on our usual spread payment: which we consider as a true identification of a retail trader. If we pay a standard spread then by definition we are retail traders.
Institutional proprietary traders (or ‘prop’ traders as they are known) trade the firms money (not clients money) and often at a reduced spread cost, or no cost at all. They are, to our mind, non-retail traders.
But to be considered a professional client, and thereby maintain a desirable margin commitment, is great.
Richard Thaler, a behavioural economist, received a Nobel prize. Speaking by phone on Bloomberg TV, he said:
“We seem to be living in the riskiest moment of our lives, and yet the stock market seems to be napping, I admit to not understanding it.”
From our fund point of view, we have a couple of lightly traded shares awaiting conclusion, otherwise we are 100% short-term (both long and short) trading of a chosen currency pairing.
We have traded GBP/JPY, changed to USD/JPY and currently we trade GBP/USD. Another consideration for us is AUD/USD.
We moved from GBP during Brexit and for the months after. With regard to price, JPY is consistent, a requirement of our strategy; unexpected volatility is not, therefore the decision, for the time being, to move back to GBP.
We do not hold overnight, so poor liquidity during this period, and an increased probability in a spike in price, is not a consideration.
Trading equities can be very different to currencies, specialization is appropriate.
I’m sure there are few things that provide more frustration than that of financial trading. The need, that we often have, to make the price on a chart move in a desired direction. We try to move price by will alone. The same as when we see a golfer on the TV try to move the path of a ball after the swing with body language.
We therefore commit, but constantly fiddle as we go. We do this in sports, we’ve done this in our professional lives – If we do this with our trades we don’t do so well.
Maybe it’s because we consider price, and therefore the chart, to be predictable and considerate. But the chart is active through the cumulative input of lots of lives, (not true, it’s mostly computers but they’re programmed so stay with me) built-up from inputs from multiples of institutions, agencies and individuals, each making their own interpretation of the outcome of price, working from multiple time frames and criteria.
Price is therefore without emotion, price does not care about our trade. Self pity about a failed trade is pointless, other than the valuable lesson it generally always provides.
Moreover, price is a ‘zero sum game’, meaning that price will only move if enough institutions, agencies or individuals are on the other side of the trade to accept the alternative trade, which builds uncertainty.
Therefore any plan for price that we have is going to seem, at some point or other, more often than not, floored; a pure fantasy. However, if we don’t trade to a strategy then we will be in and out of trades like a jack-in-the-box with small to medium losses that destroy our confidence, our resolve and our account quicker than we think possible.
So, what is the answer? Well, maybe: clarity, boldness and acceptance help.
Clarity is clarity of strategy, which means a way to trade that is so clear to us that we’re almost embarrassed to mention its simplicity. Anything more than that is too complicated and unclear to us that we will dither when we need to take a trade.
Boldness is boldness in our commitment to a strategy. No questions asked. Commit to the risk and no half measures… like reducing (or much worse increasing) the stop position, or exiting before target without good reason.
Acceptance is acceptance of change. We cannot win every trade. To try to do so clashes with clarity of strategy and boldness and the loop will quickly collapse. Acceptance in our strategy, acceptance that it works most of the time; or at least some of the time.
And if we manage correctly (rather than fiddle) then that is enough to be profitable.
I was keen on a 30% increase in the fund this year, and I still think we will do this. That sort of increase for a normal fund is very good, if done consistently it can be outstanding, but I’m after achieving a lot more. I also want control of risk.
When I trade longer term charts I do very well for a while then get hit unexpectedly. It is this uncertainty that prevents me from investing in the traditional sense.
My passion is day trading. This has come about only over the last 3 years or so. Previously I used a similar trading strategy but with different time frames. The Slow Trader Fund would be traded say from the daily or 4-hour charts, meaning a trade would be held for several days or weeks, and I would concurrently day-trade a small amount of personal money.
This has changed in that I’m shy of holding money over longer periods in a trade. I’m much more comfortable watching a trade, and be in and out again several times in the day, and never holding overnight.
The reason that I’m now doing this is that I like to be in control. Particularly if I’ve been given responsibility for other people’s money. To say that I’m day-trading, rather than using a sensible medium term investment strategy, because of my consideration to risk, is barmy to traditional investors. Because they’ve always understood that day-trading is risky.
They are correct, ordinarily. But it’s like fishing with a rod and line from a boat or free diving with a spear gun. We are not going to survive the first dive if we jump in and are expected to hold our breath for several minutes. We’d be better off and more successful fishing from the boat. But to the conditioned free diver the ability to catch fish from a free dive is far more precise and consistent.
Cynics would say ‘get a net’. But when the so-called ‘medium risk’ investors with a net hit a storm they can lose the lot. So when they think they’re medium risk they are actually not.
The day-trader will trade small and often. In contrast, for the medium-term trader the exposure is usually larger and over fewer trades. Rewards from day-trading can be exceptional. But it takes time to learn. This may have been gathered by regular readers of this blog. Like all things, I think worth the wait.
However, I appreciate that investors may have other ideas. As I’m moving the fund to 100% day-trading the funds are available for transfer at no notice. Well, one day’s notice.
To a certain extent, I trade at an amount proportional to the fund. That is the intention. But my own competency is the principal measure. For all of this year I’ve traded small. However, the trade amount, when it moves, will increase substantially.
For instance, risk per trade has recently moved from a few pounds to £150 per trade, and will very soon be £300 per trade. The next step after that is to £600 per trade, where it will stay for some considerable time. I will take half a dozen or more trades per day. Moreover, I will trade twice within the same risk where appropriate.
If we’ve mastered the day-trade then the potential is clear.
I’m often asked, with reference to my ‘fighter pilot’ days, if I ever miss it? Meaning, do I miss the flying. Mostly I don’t, and the person asking the question seems surprised by my answer.
That is because they didn’t ask the right question. Flying the aircraft, once learnt, is the easy bit. The operation, leading the 8-ship of fighters at ultra low-level through heavily defended areas to engage a target hundreds of miles away to within a margin of a few seconds, is the hard part.
And, it is the operation that I miss. Okay, not true, I watched the Red Arrows perform at Holkham this week and lived the moment, briefly.
Technical trading has similarities, albeit only two-dimensional. Familiarity with a chart, and a chart that does everything we want of it, is like flying an aircraft – when we can fly one we can have a confident go at flying anything. How to trade, develop and implement strategies is the operational equivalent.
I lost some confidence in my usual chart and broker last week when I was unable to exit a trade after the price moved rapidly, fortunately in my favour. With high volatility occasionally a broker is unable to provide a desired exit price and leaves the trade open. This, however, was not that. I was simply locked-into the trade. In hindsight the initial clue that all was not right, was the breakdown in the representation of some of my charts that I monitor on a higher time-frame.
Why, as I was in a favourable direction, was it a problem to be locked-into the trade? It is disconcerting, moreover, I had tried to exit with a scalp, and before the bar bounced, and then would have held a portion of the trade for a swing target. When I discovered that I was ‘locked-in’ my whole concentration was on getting out (completely) which I achieved some way up the bounce. This was for a profit but a good way short of the target potential.
Because of this, several days were taken to revisit other brokers to find a stable platform that does everything I want. Time consuming, but a worthwhile exercise. As a day-trader on lower time-frame charts the following are important to me: (1) spread; (2) reliable, clear charts linked to the broker that provide on chart dealing – importantly on-chart ‘limit’ entries with the ability, on chart, to set target and stop positions (3) as well as a chart zoom capability, I like to be able to grab and move the collective bars so I can quickly view stop and target positions (4) and, finally, the only indicators I use are a 21 and 55 exponential moving average but I do like a couple of easy to apply tools namely: my GLEM and a rule. (My GLEM is a modification of a fibonacci retracement tool and the rule, preferably, has to have a mirroring capability).
The above provides everything I need for me to happily trade within my strategies. Anything less is a compromise. I tried most brokers and charts and a great way to do this is to open a demo account, load the charts and try them out. I got to the stage of finding a possible contender and opened a live account. This account provided some great additions over and above. Such as: being able to part exit a trade (i.e. take some profit off without closing out the whole trade); bid/ask lines on the chart; and, the ability to simply change between single and multiple chart screen presentation.
However, after much perseverance I came back to my original broker and charts. I made many fresh tweaks to my layout and technique that were generated from my doing the exercise.
The best fighter I have personally flown would be the F-16. Okay, it’s a single engine fighter and if that engine misses a beat every now and then we could be in trouble, but (operationally) it still beat the socks off everything else – I now feel the same way about my original charts!