We talk about charts, but what’s the difference between say a 5-minute and a 4-hour chart?
One of the charts below is a 5-minute and the other a 4-hour chart. Which is which?
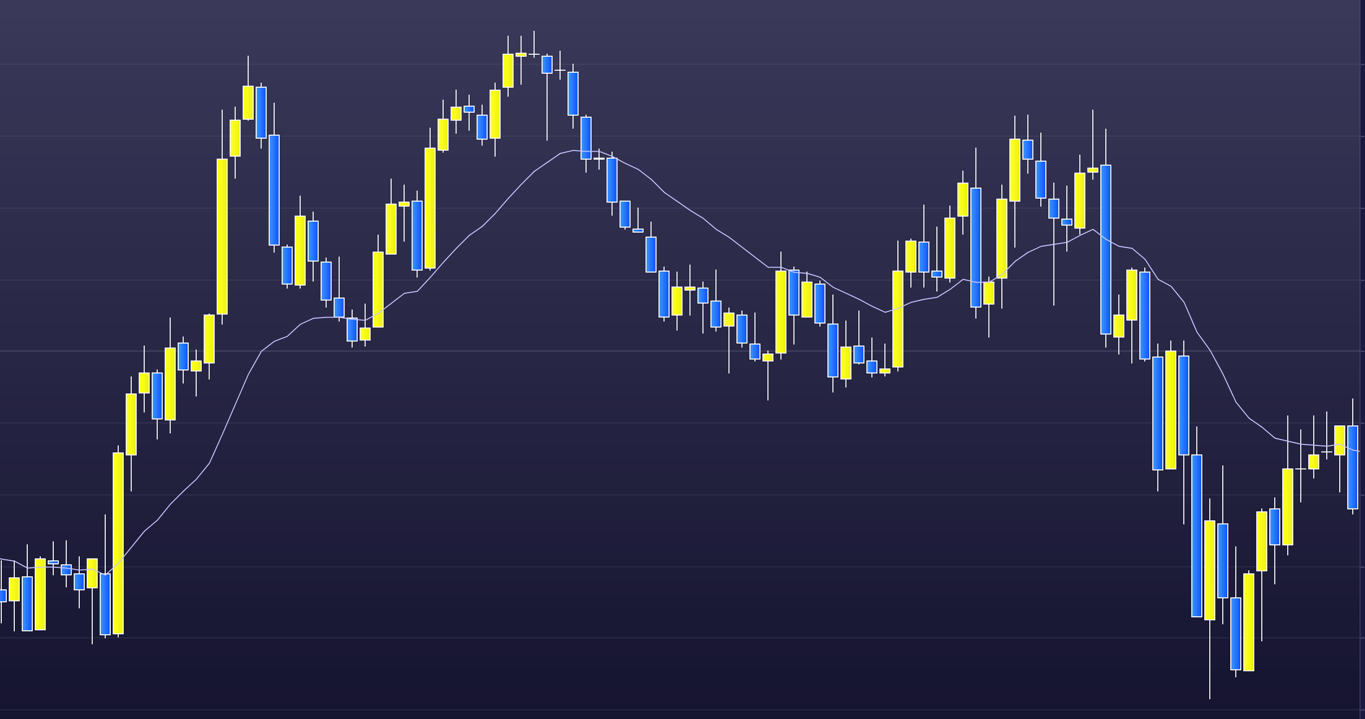
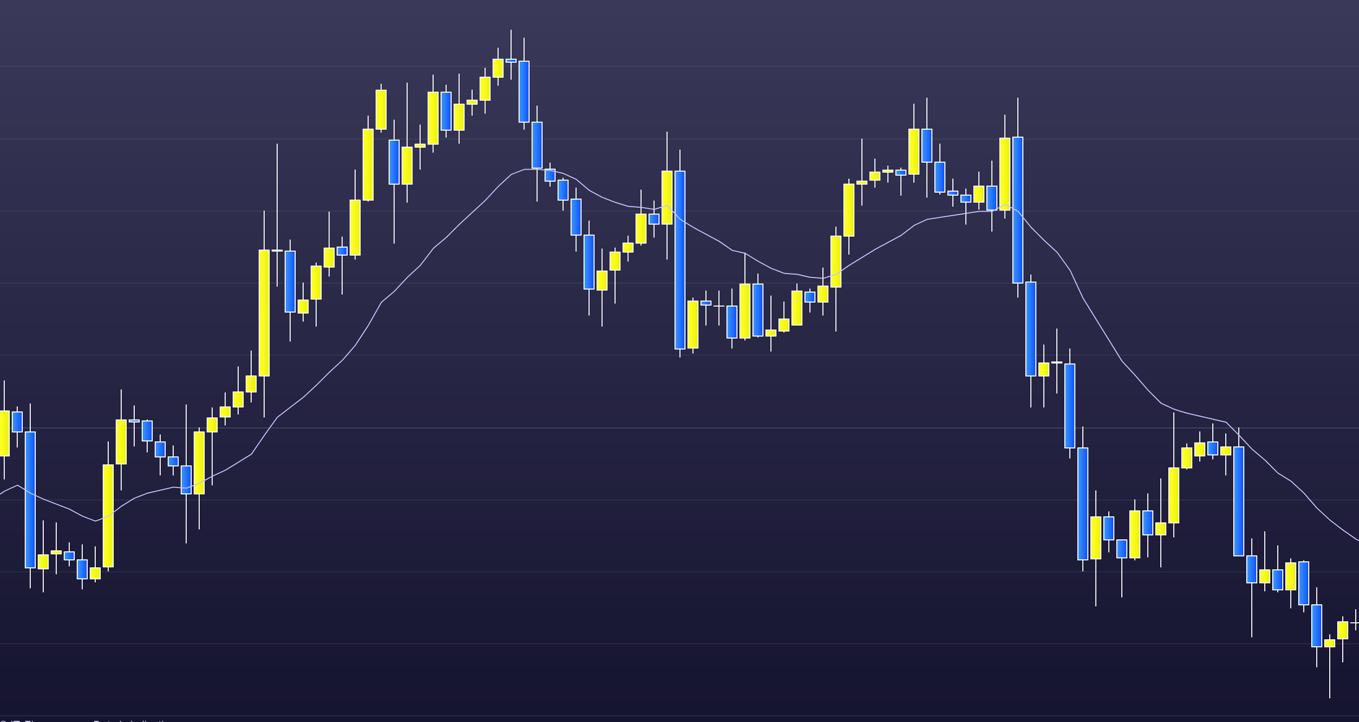
The top chart is the 5-minute and the bottom the 4-hour, I think?
The point is, charts are like the very large, the universe, and the very small, the atomic level, where there are (apparently) as many details in each.
Each chart that we use is made up from these fellas. The candlestick.
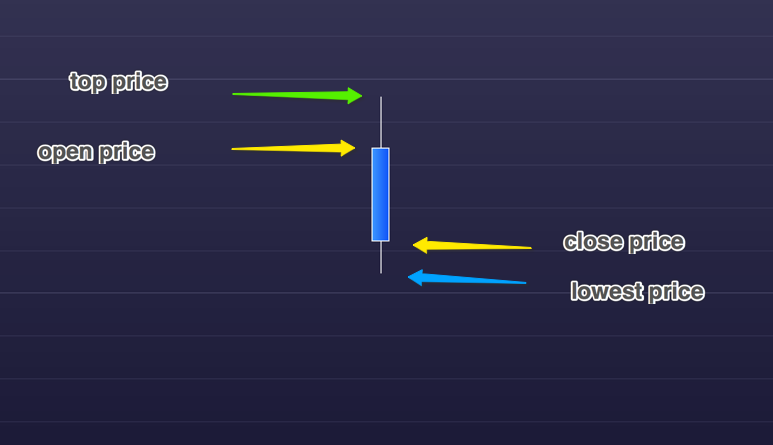
We use candlesticks, but there are several ways to show price. On a 5-minute chart the time between the open to the close of the bar is, of course, 5 minutes.
Different bar colours show a rising or a falling bar. We’ve gone for the colours above as it seems less straining on the eye.
Many starting out choose lower timeframe charts. Five minutes or less. Lower time frame charts are seen by traders as quick reward for little risk – a protective stop can be placed only a few pips away. When their account decreases (which invariably it does) they then consider only risk. Both techniques are wrong.
The problem with starting out on the lower time frame chart is that we are competing with ‘grand masters’ with only a few seconds to make a decision.
The one-minute chart is where most traders are foolishly drawn. In comparison the 5-minute chart seems positively pedestrian. Except that the 5-minute candlestick above often closes with a very different form in the final seconds of its life. Not easy.
On the other hand, higher time frame charts are not as concerned by the regular pitches in the market due to short-term news and give us time to consider: the all important context (all the bars to the left), possible set-ups and – what the shape of the closing bar is telling us – the price action.

Leave a comment