Author: Buzz Lightyear

  • Sequences and signals in the moment

    In “Moonwalking with Einstein: The Art and Science of Remembering everything”, Joshua Foer considers that chess masters don’t plan ahead as far as we think they do.

    Actually, Foer shows how such players don’t plan their moves ahead of time more than the next couple. However, he does show that through a great deal of practise chess masters rely on recognising, in the moment, many sequences of moves.

    Clearly the more skilled an opponent then the more subtle, seemingly random or non standard a response of effective play can be expected.

    In the same way as a chess master will remain open and reactive, so must a short-term trader, and particularly in the markets of heavily traded currency pairings.

    The expert trader does not fall in love with a preconceived trade. It’s simply a trade that is happening in the moment and one that the trader will reverse their decision on in a heartbeat if a sequence or signal gives predetermined reason for change.

  • Algorithm to trade by

    Nicholas Taleb, in his book ‘fooled by randomness’, suggests that “some psychologists estimate the negative effect for an average (traders) loss to be up to 2.5 the magnitude of a positive one”.

    Therefore in short-term trading, and particularly day-trading, that is a lot of pangs.

    A longer-term investor may check her portfolio, say, once a year. If she averages a 15% gain per year then this investor will have an emotional pang about one in nine years.

    The expert day trader on the other hand (the beginner and intermediate trader are off the scale here) will have 7 to 15 trades per day of which about half will be an emotional drain. Leaving the trader some 250% more emotionally drained – and that’s on a reasonable day!

    Beginners are attracted to day-trading because it sounds cool, and, as a stop order can be closer in a low time frame trade, they can trade for less per trade than on a higher timeframe chart. An individual’s chance of surviving the beginner to intermediate to expert in day trading is slim.

    An expert day trader, someone who was properly coached or who has graduated from the ranks of the higher time frame trades, will, I feel, only survive the emotional pangs of day trading if they develop and follow an (unemotional) algorithm.

    That is why I’ve renamed my page ‘how I trade’ to ‘algorithm to trade by’.

  • Long-term, what does the S&P chart suggest

    The S&P 500 is, I think, a reasonable guide for us when considering our long-term FTSE 350 top ten.

    The chart we are considering is the monthly chart, and this snip covers the last few years. The month just gone finished with what is known, technically, as a doji. This is an indecision or a trading range bar.

    The chart has been strong, having now completed a measured move up from the last pull back at about 1800. Also, the chart is currently at a big number, being 2400.

    The big number, completion of a measured move and finishing the month as a doji all point to a probable pull back at this stage. Albeit a small (in monthly chart terms) pull back; what the technical analyst would call an anticipated bear flag.

    Any small pull back will, in all likelihood, be bought and the chart pushed back up to 2400 or higher. However, if the pull back is stronger than anticipated (…the possible government shutdown crisis and the congressional fight over the continuing resolution that expires on April 28 is a factor) then we could see the chart coming back down to the 1800 level. As we’re on the monthly chart such a scenario would take one to two years.

    The bottom line is that the chart is at a measured high with a doji and significant news on the way. I would hold for a time and see where this leads. A pull back to 1800 would provide a good buy point – but, of course, in holding we may miss (and possibly the more probable) further move up.

  • Do it (trade) like a casino

    I day trade the currency pairing GBP/JPY with 5-minute bars as the primary chart. My edge for these trades includes: the recognition of context, or where the chart is in regard to a trend or a trading range; my strict minimum trade requirements (as I’m a retail trader I have to pay and, therefore, consider the spread); and, finally, my Green Line Entry Measure (GLEM).

    Each of these points are contained within a strategy that I’ve proven through ‘live’ trading and rely upon to provide consistency over time for all of my trades; a strategy – because of the nature of the game – that is always open for amendment. A strategy that makes us more like a casino; the management of the casino rather than the gambler.

    A casino – after taking into consideration all the big winners, the big losers and everyone in between – will consistently take 4.5% in profit from all takings, over time. That is because they too (the casino) are working to a tried and tested strategy. My volume is, of course, nothing like a casino, so I need to take trades that are 60% probability or better. If less than 60%, on the rare occasion that I select low probability trades, I need to have a consistent reward/risk that makes the trade worthwhile.

    Moreover, I also trade the Slow Trader Fund in several currency pairings, the commodities of gold and oil and Nick’s top FTSE 350 companies. These are all traded with the 4-hour bars as the primary chart. I’ve chosen 4-hours as this provides multiple trading opportunities a week. Moreover, with my day trading my charts need to be linked to my broker as I require an accuracy here of 0.1 of a pip. These charts (British broker) do not provide the important New York close bars which would be required if I were to select entries from daily bars. Hence, another reason for 4-hour instead of daily bars.

    With regard to Nick’s top FTSE 350 companies, please do not miss read me here, they are, for investors, a long-term consideration. They came to the fore because of their strong fundamentals and ‘value’. Because of their strength, fundamentally, these companies could ‘weather’ a market turn down (or two) better than many. I have placed them in the 4-hour trade cycle but: with my context, probability and price action strategy, it could almost be any ten companies.

    As an aside, the best index for technical judgment of the longer-term market cycle, I consider, is the weekly or even monthly bars of the S&P 500 index. Yes, even for companies within the FTSE 350. Movement on the S&P is generally followed by the FTSE. I’ll provide a S&P synopsis soon.

    To finish, we have detail on short-term trading (my day-trading and 4-hour chart work) and information on the very long-term investment considerations (Nick’s top ten). However, we do not have information on the mid-term investment/trading opportunities. This is not my area.

    Steve, however, has a great track record in this regard, and one that is just getting better and better. A key member in a ‘high energy’ company, Steve is responsible for a budget that annually goes into the multiple millions. Therefore, not a full-time analyst but someone who has put his working skills to good use in selecting mid-term investments. From many examples is his purchase of Sky PLC in early December, and before Sky made a 25% positive jump.

    I will ask Steve, if he’d make a contribution to this blog and share with us his mid-term ideas and thoughts. I hope he will agree.

  • Slow Trader Fund, We’re Ready for Action

    Thank you for your patience while I’ve performed a complete overhaul of my short-term trading strategy. Readers will notice the amount of work involved in the ‘how I trade’ page. This has been a great exercise, and one of which I’m confident will be well worth the wait.

    A reason for taking so long is that our strategy, I believe, can only truly be devised under live trading conditions. The way we react to probability trades under live conditions is significantly different to what would otherwise be developed under benign back-testing conditions.

    To that end, I’ve traded and worked on the strategy these last few months with my own account and traded small. The fund has remained in waiting.

    Now I’m at the other end of the strategy development, we will see a gradual build-up to normal fund trade amounts.

    My thoughts on how I see the fund going forward from today:

    Slow Trader allows investors the opportunity to access a short-term trading fund.

    Why an opportunity, and why short-term trading is not possible for most people:

    • Firstly, short-term traded funds are not readily available. Moreover, expert (and hopefully successful) short-term traders charge a lot – up to 50% of profits and large participation fees.
    • Secondly,  short-term trading is a difficult skill to master. It takes several years for a trader to graduate from the ‘beginner’ level, through ‘intermediate’, to ‘expert’. And, expert is where all the capitalised reward is found. In other words, short-term trading, in contradiction to its name, takes a long time to learn.
    • Finally, learning the short-term trading skill is often, through the beginner and intermediate stages, financially penalizing.

    From the 4-hour chart the fund trades:

    1. Nick’s qualifying UK shares – long only.
    2. Currency pairings GBP/USD, EUR/USD, AUD/USD, USD/JPY – long and short.
    3. Commodities Gold and Oil – long and short.

    For each of these I’m looking for an edge:

    1. Nick’s qualifying UK shares already have the fundamentals. And, although fundamentals are normally not a factor for a trade of less than 9-months duration, we nevertheless have them on our side. The principal trading advantages that I use, however, are probability, context and price action.
    2. In our currency pairings we again bring probability, context and price action to the fore.
    3. Commodities also use probability, context and price action but are also traded inline with the COT report.

    The 4-hour chart is used in preference as this provides at least two trading opportunities per day. This means that trades can be open from several hours to several days.

    The page ‘how I trade’ is written with the 5-minute chart in mind but applies equally to the 4-hour chart and is the essence of how I approach probability, context and price action. Nick’s qualifying UK shares are published quarterly through this blog and guidance on the COT will also be given as the COT occasion provides – the COT cycle for each commodity coming round independently a few times a year.

    I provide an annual detailed report on the fund and a semi-annual ‘how goes it’ review.

    The goals of the fund are:

    1. Not to lose money (and this defines our risk level)
    2. Increase the fund by 30% (as a minimum year on year)
    3. Compound the fund year on year
  • Buffett, an investing dinosaur?

    I appreciate that we don’t have much time to read a blog, often on a mobile device and while we’re busy concentrating on something else. Meanings are easily misinterpreted. Moreover, true longer term ‘value’ investing is not a popular investment method. We want gratification earlier.

    Someone close to me this weekend considered me wrong with the longer term investing methodology, suggesting that: (1) the market has changed and a five years investment model is long enough, (2) Buffett is an investing dinosaur and (3) proceeded to tell me why Blackberry really failed.

    My initial explanation (blog) must have been poor, so I hope I can provide more clarification.

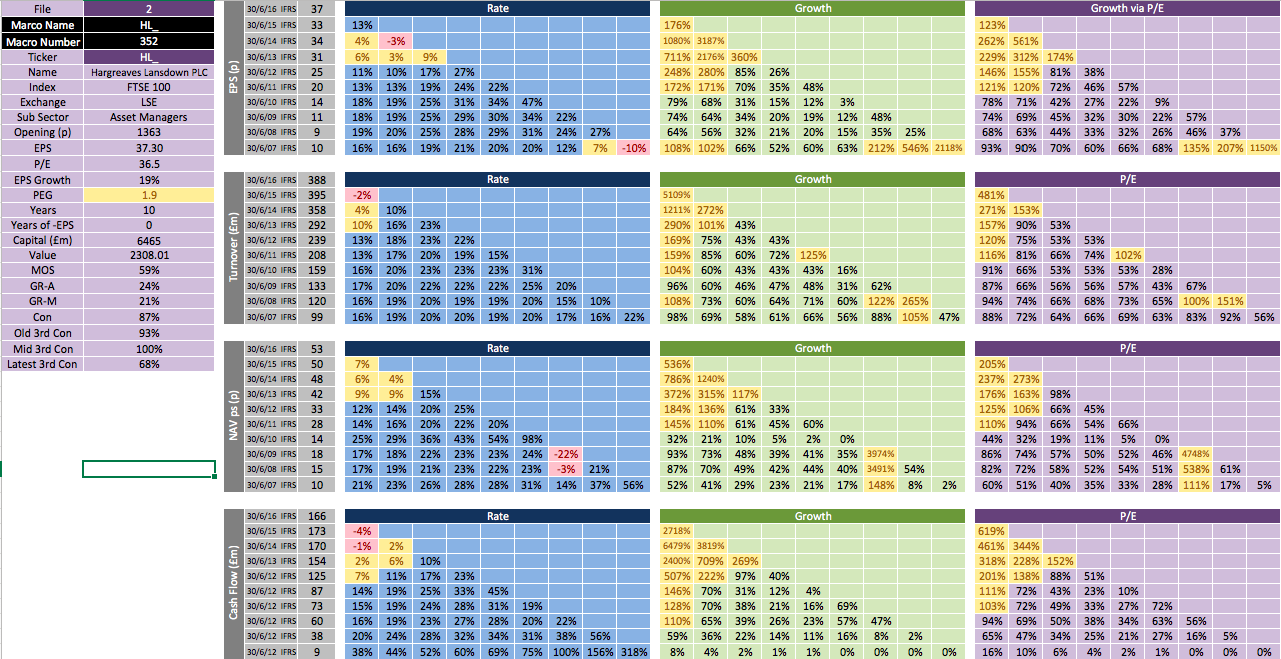
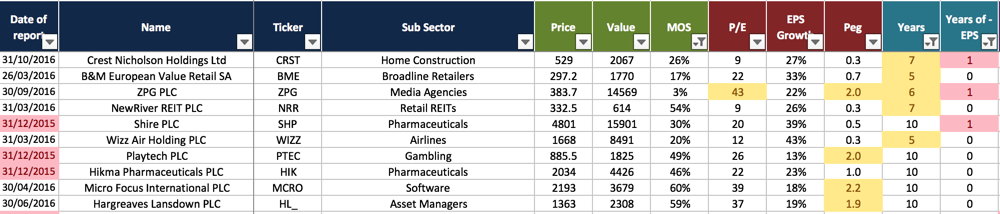
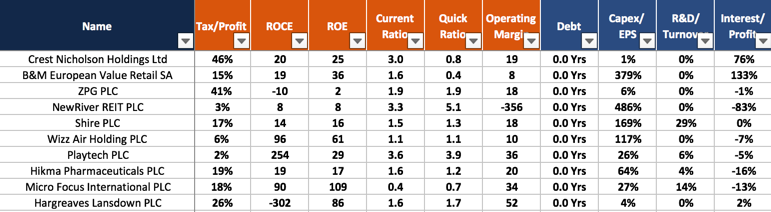
    The numbers that we provided to back up the top ten shares can be confusing. We are looking for companies that ideally have ten years of reports showing no debt, a great consistency in growth and are available at the bargain price of fifty pence on the pound.

    The latter refers to the margin of safety (MOS) that Graham coined. That is the same as being able to go to a BMW garage and purchase a £40,000 car for £20,000. A good deal. That is what the MOS is telling us. What it is not telling us is how good the car is.

    All the many books available on how to calculate the MOS can be obtained and studied closely and it would still be very difficult (and I’m not kidding here) to find a solution for the MOS. That is why what Nick provided us with is a gift.

    Because we don’t know how to work out the MOS, many times we are buying shares at £2 or £3 on the pound. That is like going back to that BMW garage and buying that same car, but now for £80,000 or even £120,000. That sounds like a silly thing to do, but we do it when we buy shares!

    I was wrong to provide a suggested timeframe for longer term shares. It seems that some have latched onto that guidance I gave – when really it’s an individual interpretation of what is longer. My suggestion allowed for a purchase at any point in the market cycle. But I don’t know, and nor does the buyer probably, at what point in a market cycle they are at time of purchase.

    As for Buffett being an investing dinosaur, the methodology comes from Graham, and he was the generation before Buffett. But in any case, it’s nothing to do with either of them really. Buying something for fifty cents on the dollar is as good a market trading philosophy today as it was in Babylonian times.

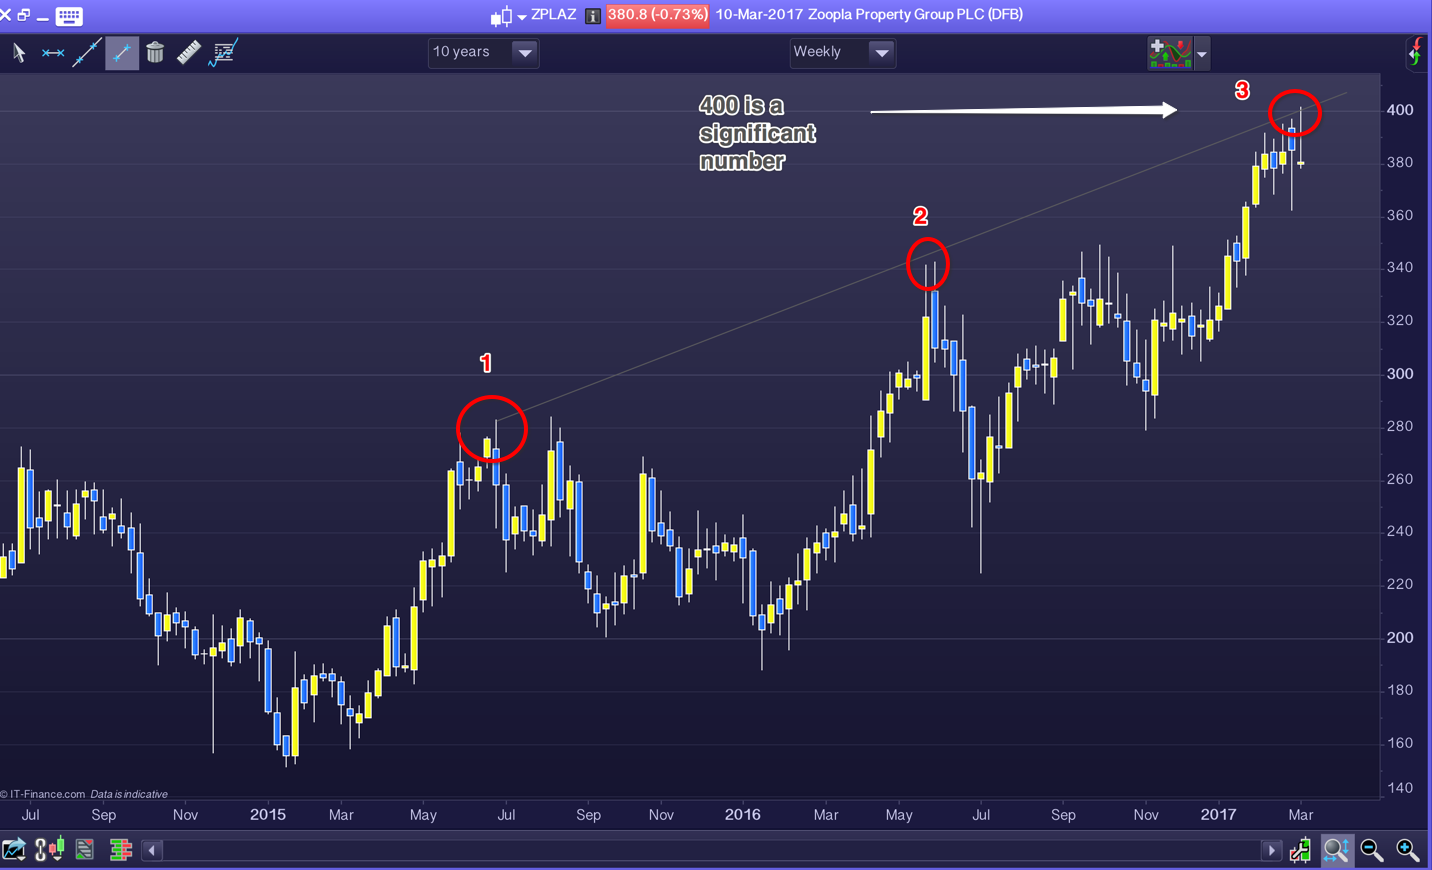
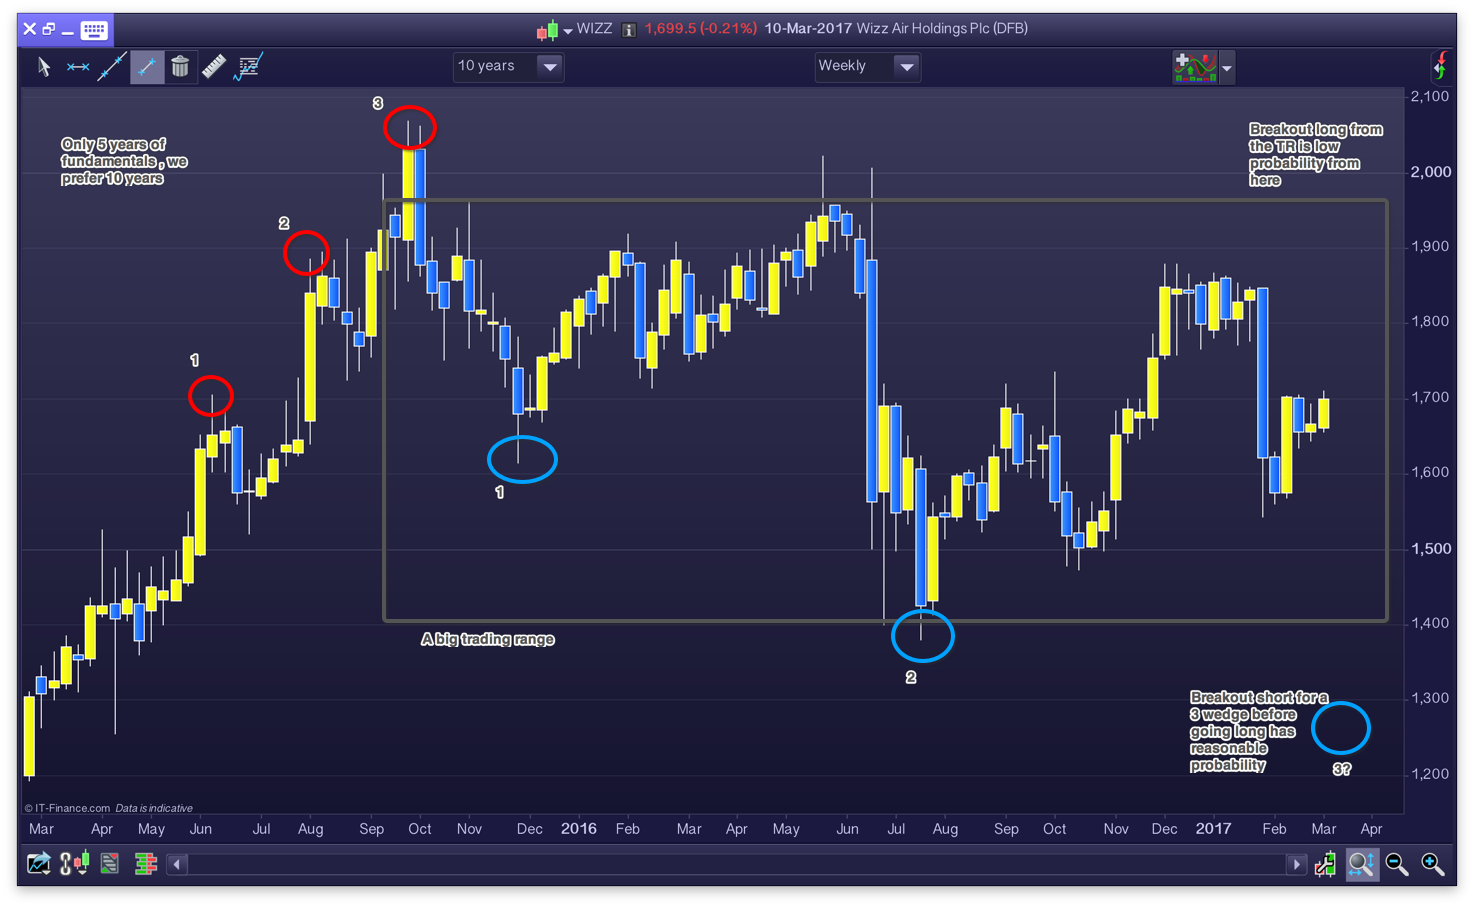
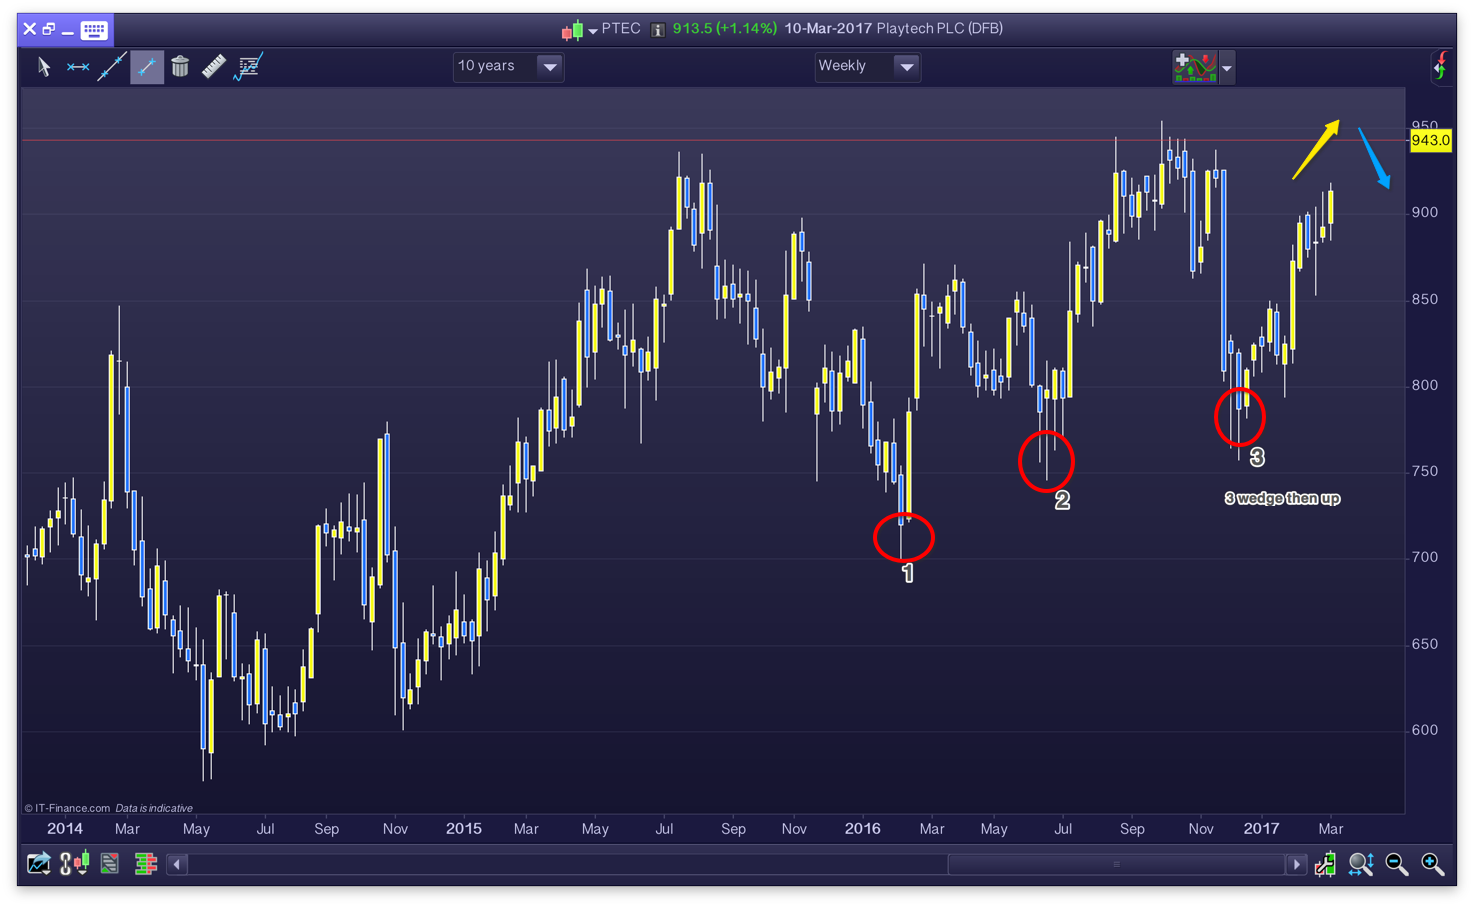
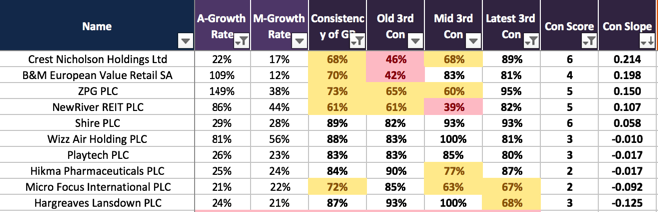
    As for Blackberry, this was given as an example only of what to watch out for. Kodak is another. It doesn’t matter here about these companies. I was merely trying to say that such companies can show up on Nick’s list but are about to crash. That is why Nick has provided the 1st, 2nd and 3rd periods of measured consistency to help us spot such companies. And for those who think it’s easy to see such companies coming, sure it is after the fact, but most of the brightest analysts in the world didn’t at the time.

    Market cycle is worth a further mention here. I’m not a doom and gloom thinking guy, quite the opposite actually. Benjamin Graham gave up at one point because he couldn’t find companies that provided value, a MOS. This was prior to the great depression. From 350 companies we would expect to find about 10% with a qualifying MOS. On the last run 3% qualified, and some of those are questionable as they don’t have the 10 years of reports.

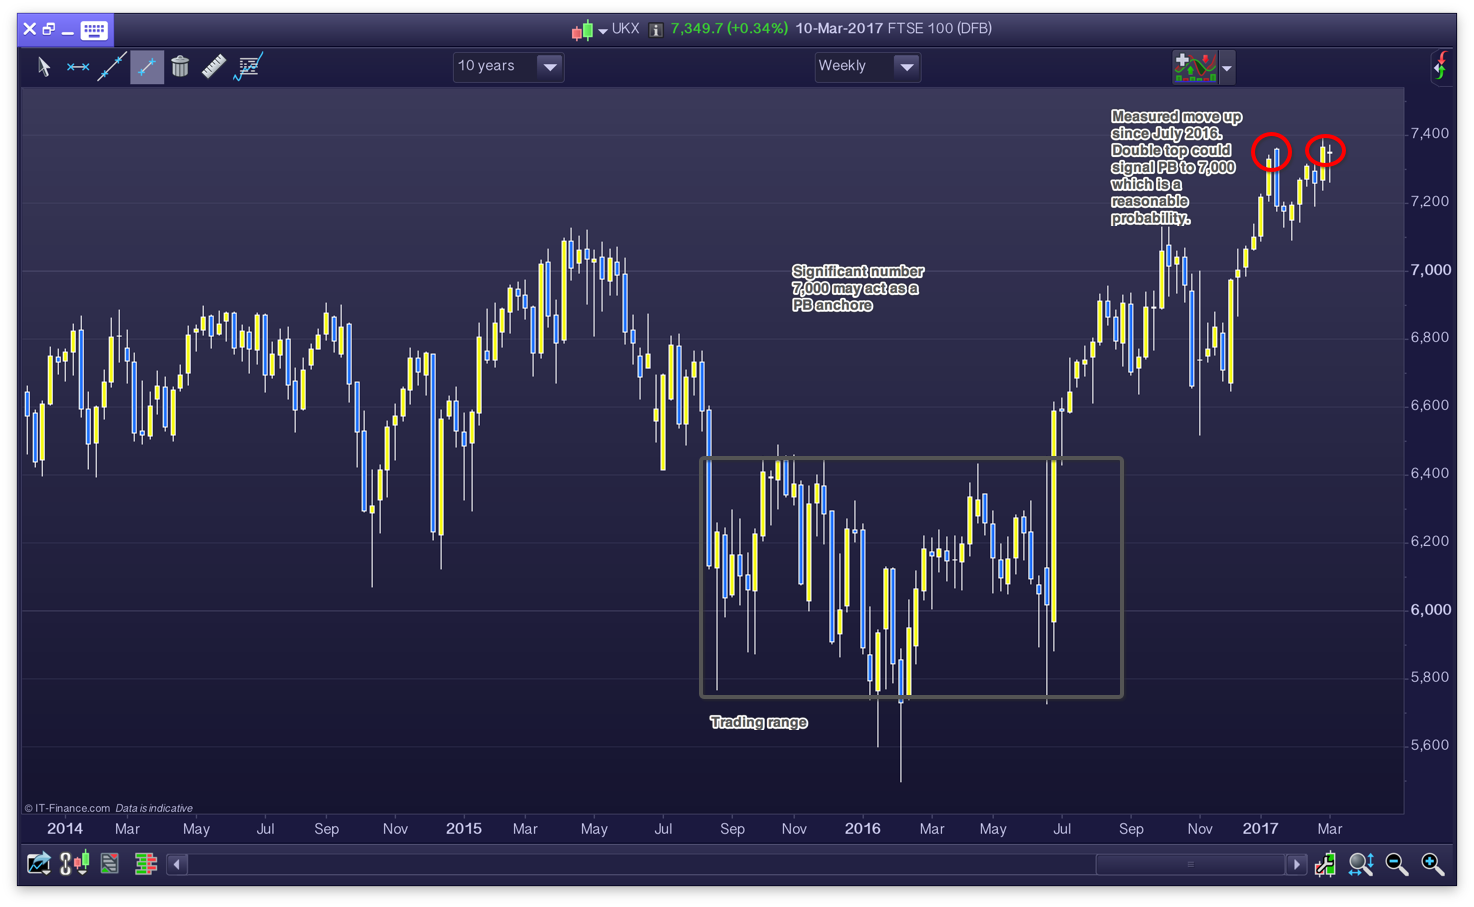
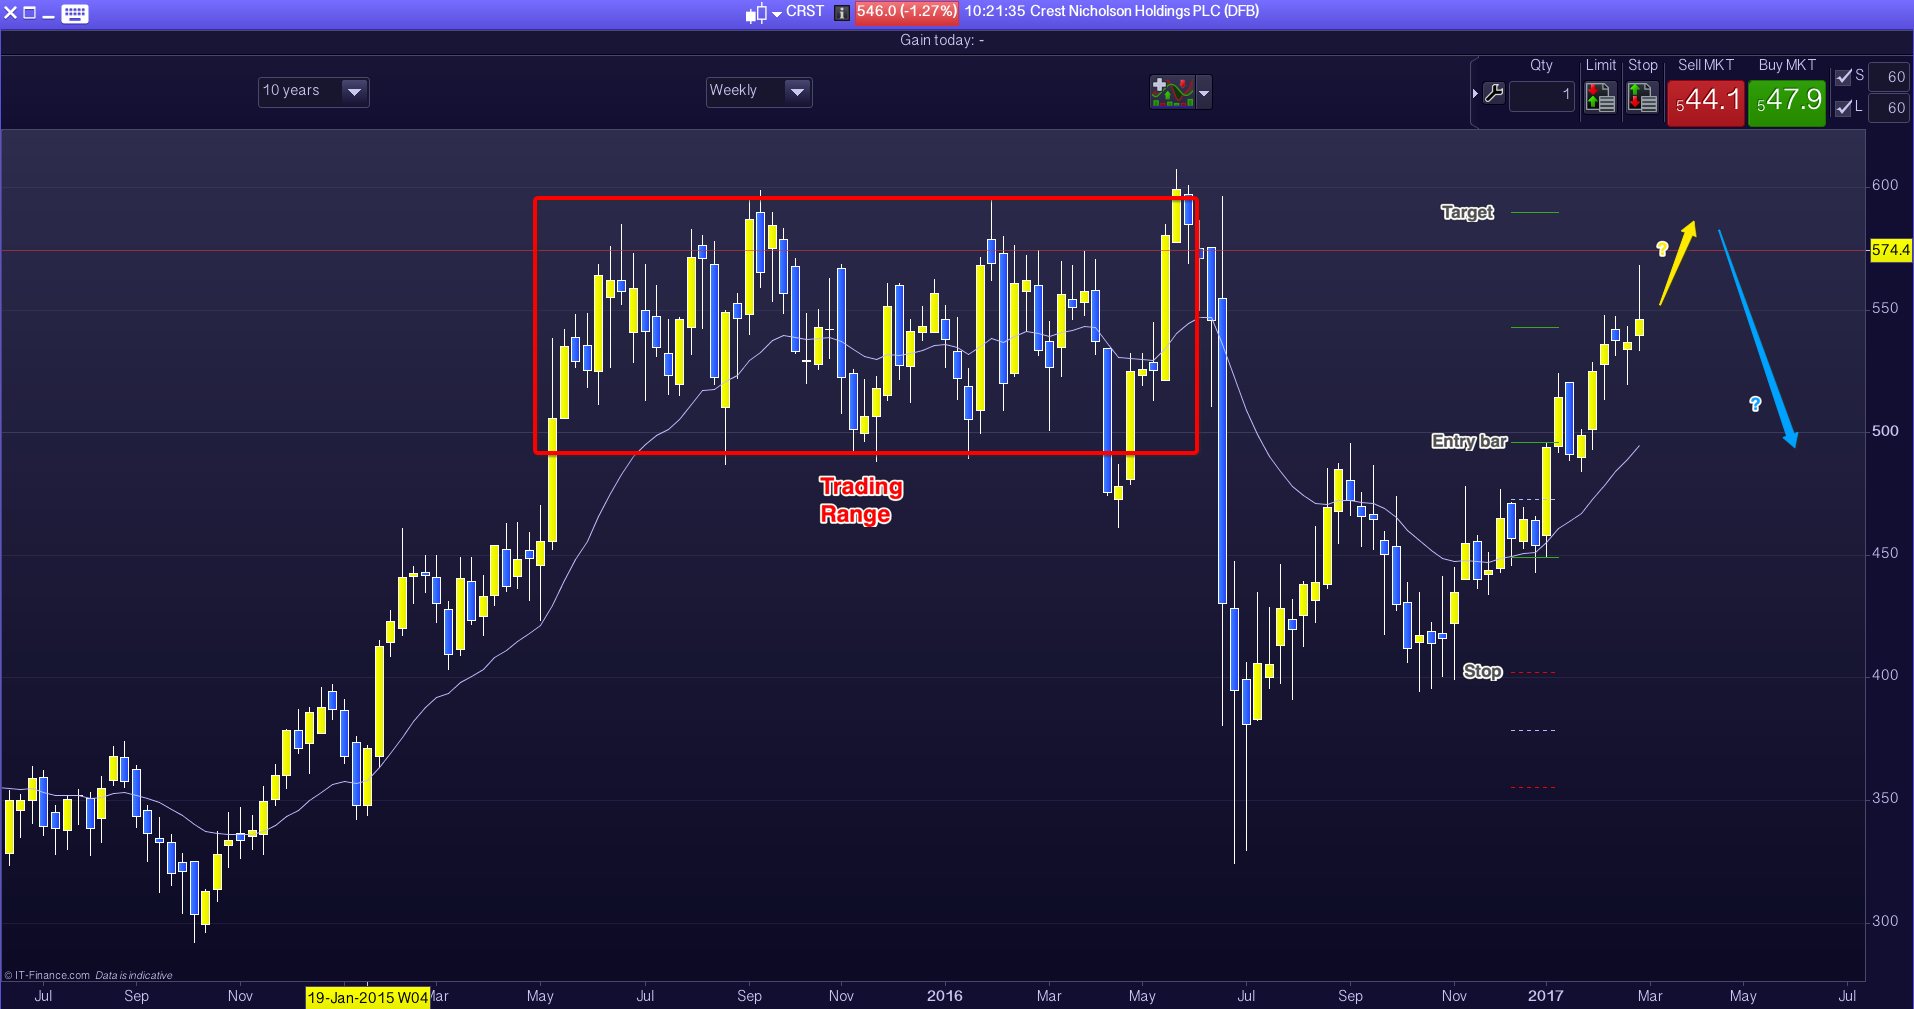
    I don’t recall any of my chart analysis providing a ‘buy me now signal’ either. Moreover, once the daily press has front page news telling us it’s a great time to buy – well, you know what I think about that.

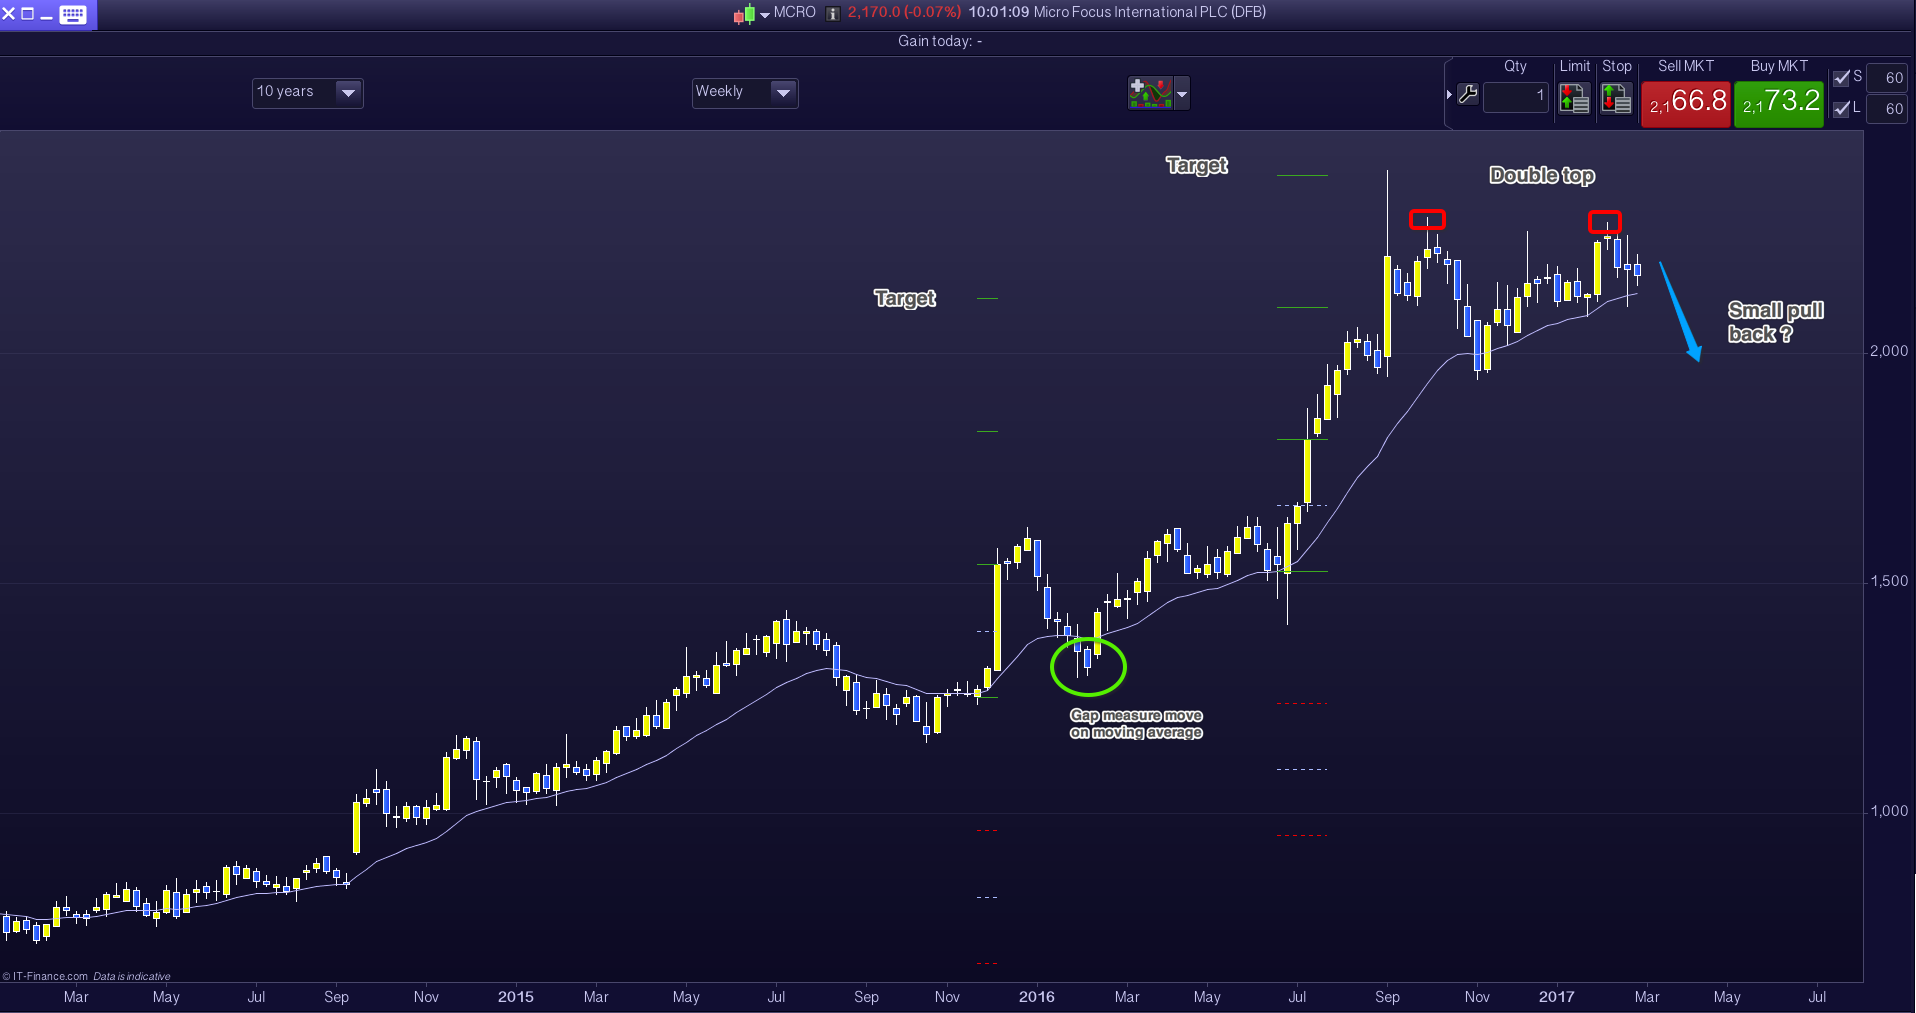
    With 5-minute bar charts I deal with a major trend reversal a few times a week. With such a chart it would not be possible without the X/Y values showing to tell the difference between this and, say, the 2008 market crash on a weekly chart. So the short-term trader gets a lot of experience with market reversals.

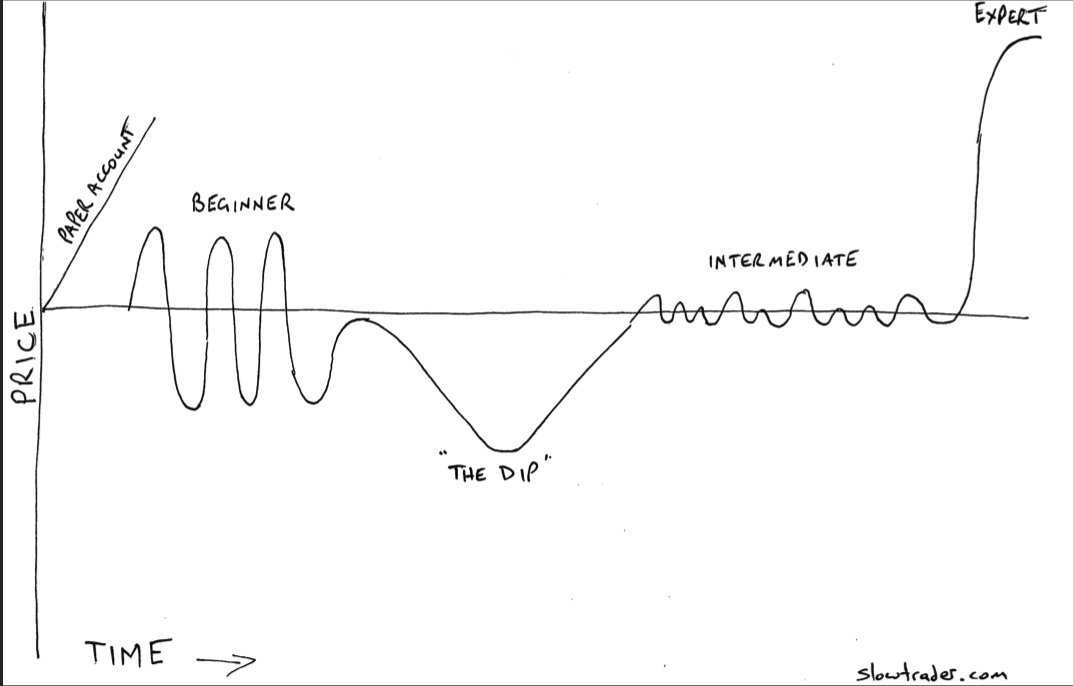
    More often than not, a beginner trader will trade a reversal too early (this is the case for both short and long-term trading/investing). Only to be stopped out at a higher price – in the case of a bull reversal – and watch from the sidelines as the market eventually drops. On a 5-minute chart such a reversal can take hours, on a weekly or monthly chart it is years – or at the very least many months.

    As a final thought, value investing, or the interpretation of fundamentals, is not generally considered a suitable methodology for mid-term investing. There are alternatives. For example: taking advantage of IPOs, share splits or runaway news, events, fads and fashions. I particularly like the interpretation of the COT report with commodities for mid-term investment.

    I hope this helps.

  • Trading in the Zone

    I read Mark Douglas’ book ‘Trading in the Zone’ some years ago, when I was at the beginner stage of my current trading strategy, and I didn’t get it.

    Yes, the principles that Douglas provides are simple and easy to grasp, but to truly relate to what he is saying, and how it applies to what Douglas calls the ‘traders mindset’ is another thing altogether.

    I think that a trader needs to be at, or in the early stages of, the ‘expert’ level as a trader to properly grasp Douglas’ lessons.

    A beginner tries every kind of strategy going, which is fine, as long as the trader can settle on a particular way forward without a great deal of variation in the overall principle of a chosen strategy; to do so is the only way that a trader can move from beginner to intermediate.

    The expert level is the cumulative refinement of ones strategy and a complete acceptance in that strategy. And that’s the easy bit. The hard work then comes with mastering Douglas’ traders mindset.

    If we are a beginner or intermediate we ain’t going to get the importance of Douglas’ concept because, at the beginner and intermediate levels, we haven’t yet fully accepted responsibility for our strategy. In other words, we have not yet emotionally matured as a trader and fully accepted the probability of our trading strategy.

    You see what I mean, all you beginners, you probably have no idea what I’m talking about! Read Douglas, and read it again when your foot goes on the first rung of the expert ladder – believe me, its like a light coming on.

  • More on the long-term investment model

    My recent blog(s) were in regard to long-term investing. By long-term I’m thinking 15 to 30 years. Nick has given us, from each companies past ten years of annual reports, where available, his estimation of a company’s future value (MOS) and measure of consistency as a percentage of growth.

    From the FTSE 350 companies, Nick found that only ten companies met his criteria. Of these top ten companies, meant for long-term ISA or SIPP investment, we need to understand the principles of the company and be satisfied that a company has a product, method or brand that will be around after the next ten years.

    Nick has provided us with an old 3rd, mid 3rd and latest 3rd consistency to help us determine this. For example, Blackberry would have scored highly all the way to its end on this system; however, the clue would have been in Blackberry’s old, mid and latest consistency which would have shown a big down slope.

    Nick will refresh these calculations every few months. Primarily to capture the most recent annual report – three of which, on our current calculation, were from the end of 2015. To help, or possibly confuse, I’ve provided a brief chart synopsis of each of the top ten companies. I will continue to do this at the release of an updated calculation from Nick.

    New readers to this blog please note that my full-time business is short-term trading. Most of my blogs therefore will be focused on the short-term stuff. My detailed ‘how I trade’ page is only associated with short-term trading.

    Personally, I’m only in favour of short-term and the very long-term trading/investing model. I’m not in favour of the mid-term trading timeframe which constitutes the majority of the trading/investing world – pension funds and the like. This is a timeframe from the near term out to 15 years. I also feel that many pay too much for the services of providing mid-term investing. ‘Tony Robbins, Money Master the Game’ shows how every 1% in charges results in providing the investing company 20% of the final fund. Possibly a reason why a finance company made our top ten!

    If we are to invest in the mid-term, Robbins advocates a cash, share, commodity and bond mix. There are a few investment companies that provide such a fund – an independent financial advisor could help. Such funds are not exciting when the share market is going up rapidly; but such a fund usually provides a profit  – even when the share market heads south.

  • The remaining top share picks on a chart

    To complete our take on the remaining top ten FTSE 350 shares here’s the final few from last week. As I’ve explained, the main purpose for these shares is their fundamentals. As we are looking at particularly long-term holds the chart (even a 10 year weekly bar chart, as shown below) becomes irrelevant. However, it’s always nice not to have to spend the first few years of ownership out of the money. Therefore, please do your own due diligence but these charts may help.

    Zoopla has a clear 3-wedge up which could signal a pull back. However, if the pull back is weak there is a reasonable probability of a measured move up of the whole wedge, to the 600 area. 

    There is a 50% probability of a pull back with Wizz to the 1,300 area, as marked below. However, price is currently centrally located in a possible big trading range (TR) so a push up to the top of the marked TR is a consideration. The big TR will only reveal itself after another touch at the top and bottom.

    Shire is a lot at 5,000. However, do not misinterpret this as expensive or over valued.  Price and value, in this sense, as we know, are not correlated. Pharmaceutical companies are liable to large share price movements. Shire being one of the more stable for reasons that our further due diligence will reveal. Again, we are looking for a break out here from its previous high of about 5,750 or a pull back to firmly cement the bottom of the trading range.

    Whatever your thoughts might be about a company such as Playtech – online casinos and the like – it has been a consistent member of our top ten. Since 2012 share price has more than tripled and from our fundamental calculations is still only 50% of its future value. The last annual report for Playtech was at the end of 2015, so I’m waiting to see what the next results provide.

    The FTSE 100 is largely influenced by the big commodity companies, even though it is weighted by market capitalisation. Therefore I’d be reluctant to use the FTSE 100 as a barometer for our top ten shares.

  • Know this one thing and save £15,000 as a trader.

    snip20170304_34

    Knowing the timeline above would save traders £15,000, on average.

    Paper Account:

    Most people start trading with a paper account. That always goes well. However, it is not reality. Pip Maven recommends that a paper or dummy account should be for no more than 4 weeks, enough time to get familiar with the broker’s site.

    Beginner:

    We then become a ‘beginner’ trader. We trade small, and to survive this stage trading small is vital. During this phase we try many strategies, follow many teachers. One minute we think we’ve got it, the next we haven’t. It’s also the rollercoaster phase.

    “The Dip”:

    The Dip, by Seth Godin, is well worth a read. A short book but explains how the dip applies to everything we try. And trading is no exception. We can enter the dip at any point, not necessarily at the end of the beginner phase and  before the intermediate phase. It could be half way through the  intermediate or just before expert – but go through it we will.

    Intermediate:

    This, as Pip Maven explains, is where a trader has settled down to the grind of it all. No longer looking and changing to everyone else’s system, but focusing on our own, unique, way of trading. Managing our trades with attention to the smallest of detail.

    My drawing above is not to scale. If we picture the beginner phase compressed into the goal area of a football pitch, the remainder of the field is the intermediate phase. This, as a minimum, would be more representative. 

    Expert:

    If we survive the intermediate phase, or the grind, then we have a chance of achieving expert level. And, of course, that is where all the benefit is.

    Save £15,000

    How do we save £15,000? Simply by being aware of the above phases. When and if we make the intermediate phase we realise that this grind is part of the game. We do not get frustrated and do something daft. On average traders do something daft during the intermediate phase – it’s a long time after all – and lose £15,000. Now that we are aware – instead – we stay with the programme, whatever it takes, to achieve expert.

  • Top ten companies that are selling at a discount – FTSE 350

    On the previous blog, also dated 25th February 2017, Nick has provided the list of companies from the FTSE 350 that made the grade for our long-term investment.

    The spreadsheet was the cumulation of focused effort by Nick and me over a 9-month period a few years back. Nick, spent, subsequently, a considerable amount of time improving the calculation.

    Here’s an example of the back sheet of information that is taken for up to 10 years of figures for each company in the FTSE 350 – and this does not show the mind numbing calculations that are used within each of these boxes.

    screenshot-2017-02-24-11-15-36

    We must emphasise that this is meant for longer term investment. The principles of which use many ideas from the great investors, but primarily that of Benjamin Graham and Warren Buffett – and, if you know these investors, we are talking longer term.

    Nick has only provided FTSE 350 as the information is aimed at UK ISA or SIPP investors.

    Here is a synopsis of the filters of the principal figures used: “and, we have to say, principal figures that cannot be found anywhere else” 

    Margin of Safety: price is less than 60% of value

    Age: more than 4-years trading with less than 2-years of negative earnings

    Growth: a growth rate greater than 10% to ensure a reasonable rate of return

    Consistency: 10% growth rate in all variables – consistency score greater than 60%

    (Blackberry conundrum: consistency of growth improves over time)

    You will notice, in the more detailed sheets below, that annual report dates can be over 12 months old. That is because of the release time of annual report information. Although we are long-term investors with this information, Nick will run the calculations every few months to capture annual result information reasonably early.

    Here is the more detailed, and most up to date annual report information, on each of our companies that made the cut:

    snip20170225_2

    snip20170225_4

    snip20170225_5

    Finally, anyone using this information to invest we must, of course, point you to our disclaimer page. Also, it is important that individuals do their own due diligence. It is important that, as investors, we understand the company we are investing into. The information above is detailed but we must determine for ourselves if we think a company has legs for the longer term.

  • Which companies make the grade for long-term investment, FTSE 350

    Name

    Ticker

    Sub Sector

    Crest Nicholson Holdings Ltd

    CRST

    Home Construction

    B&M European Value Retail SA

    BME

    Broadline Retailers

    ZPG PLC

    ZPG

    Media Agencies

    NewRiver REIT PLC

    NRR

    Retail REITs

    Shire PLC

    SHP

    Pharmaceuticals

    Wizz Air Holding PLC

    WIZZ

    Airlines

    Playtech PLC

    PTEC

    Gambling

    Hikma Pharmaceuticals PLC

    HIK

    Pharmaceuticals

    Micro Focus International PLC

    MCRO

    Software

    Hargreaves Lansdown PLC

    HL_

    Asset Managers


  • Here’s the trick, part 2

    Here’s the trick, part 1. To help emotionally, once I’ve entered a trade, I can mentally consider that the trade is lost. I don’t think of it as being part of our account. It’s gone. My true account is our total less the risk of any open trades.

    This is what the crowd is doing and therefore will lose us money. Instead, flip it.

    Here’s the trick, part 2. When I have spent most of my time waiting for a great entry consider the win from hitting my target as money in the bank. I mentally add it to our account.

    The risk of the trade represents £100, for example. As I enter the trade I mentally add the £100 to our account. It belongs to us. I’ve spent the time finding the entry, therefore, the planned result (i.e. the winnings) belongs to us.

    It’s now our money and we manage the trade accordingly – with a bit more fervour and positivity than I might otherwise.

    Our goal of not losing money includes the planned result of this trade. I don’t exit the trade because of fear, because to do so means we lose money that we know is ours.

    Unless I make this mental leap it is too easy to exit a trade thinking I can’t lose what we havent got. Wrong, it’s ours, we’ve earned it. Now pay up Mr Market.

  • How to make a million short-term trading

    The last time I said ‘its great to know that I can make money, every day, short-term trading’ I fell off the wire. Not too high a wire, but a fall nonetheless. So I’d be silly to say it again, but I’m about to. The thing is, that is what short-term trading is all about, being absolutely precise about it.

    My last fall was only a couple of months back. Prior to that I’d been in control and trading at the one million level, albeit for just a few weeks.

    What the devil is the one million level and why did you fall?

    The one million level.

    As short-term trading should be/is precise – that is, on average, we know how many trades a day meet our criteria – we can determine how much we can earn each and every trading day. Now, to most traders this sounds barmy because most traders lose. Yes, that is correct, of those that use a spread betting platform to short-term trade, and that is most traders in the UK – and the subject of a future blog – only 5 to 10 percent win. And I think it’s closer to the 5 percent. So to say that we can be precise is a long way, in the non winners eyes, from making sense.

    But lets come to that some other time, for now, what do I mean by this one million thing? Lets agree firstly on the amount of trading days available to us in a year. If we take away weekends, bank holidays and some much-needed holiday time for ourselves we are left with about 200 trading days. For me it’s somewhere between 100 and 200 trading days – as to find 200 solid, undisturbed days is difficult, and I only trade when this is so and I’m feeling good.

    However, the principle still holds. Most professionals will achieve 200 trading days in the year. If it takes me 18 months, or some figure either side, then that doesn’t matter. What does matter is how much we can earn on each of those days. Even if we’re an extremely successful short-term trader, the amount we can or cannot earn on a daily basis is based on what we can handle emotionally. If we get to the point where the amount we are trading alters the way we trade then we’ve gone through the ‘no go through’ emotional barrier. And, unless we pull back in our trading size we’re about to very rapidly join the losing crowd again. I say again because we’ve all been part of that crowd for most of our trading experience. One part of trading successfully is that we must trade financially within our ‘it doesn’t effect me’ level.

    That said, you will see from my ‘How much do we risk’ page that I have two distinct trading levels. One is designed to provide a daily amount of £500 a day, and the other £5,000 a day. The £500 is just the build-up to the £5,000. And the £5,000 a day, when we multiply that by our 200 trading days, gives us our one million. Professional traders will build-up in stages. Once £500 is achieved they will next move to £1,000, and so forth. I’ve already built up and been at the £5,000 level – right up until I fell off the wire – so I know that, emotionally, I’m fine at this level. I’ve also found out why I fell off and I’m fixing it.

    I should work for 3-months at the £500 daily level and move up to the £1,000 level for a further 3 months before going again up to the £5,000 daily level. However, I don’t need to prove to myself that I’m fine emotionally at different levels so I’m staying at the £500 level for the whole 6 months, or until I know that I’m ready, and then move straight to the £5,000 daily trading amount. That is because the risk/reward calculations for each trade (£500 and £5,000) are the same – I simply add a zero to my trading amount. The transition to £5,000 daily trading is, for me, easier this way as the well practised mental calculations are the same – just one zero bigger.

    In my last blog I talked about the very important ‘edge’. This is a dramatic word so instead I’m going to call it my ‘green line entry measure’ (GLEM). One of the reasons I fell from the trading wire, so to speak, is because I hadn’t properly defined my GLEM system. Or in other words, my final reason for why I’d enter a trade. As I trade over the next 6 months at the £500 level I’ll develop and prove my GLEM system more and more. A further reason for my fall is my weakness to trade a trending ascending market. We all have favourite cycles within markets – some traders build their entire strategy around a certain cycle and will wait for as long as it takes for that cycle to come around. I’m good in the trading range and descending trend cycles but, as I say, lousy at an ascending trend. That needs to be solved and is one of the reasons I redefined my GLEM system.

    So there we have it. Our goal is to achieve a million return from 200 trading days. Which for me, after the 6-month preparation, will take, realistically, between 18 to 24 months. That’s the challenge.