Tag: COT

  • gold and silver – are prices ready to drop?

    Copper – An uneventful week for the commodities. All except copper which moved down without us and with gusto. Copper, however, had an unclear read on the COT (often the case with copper) and an unclear read on the daily charts. Therefore we are correct to be out – as to stay in would have been to rely too heavily on hope.

    Crude oil and USD CAD – We hold a small position on crude oil short. But a 200 pip climb is likely and at which point we may add to our shorts. USD CAD, which often reflects a delayed but exact opposite price movement to crude oil, shows a clearer picture. Too much reliance on the difference between these two charts (crude oil and USD CAD) is, however, a ‘chicken and the egg’ question and should be considered but not relied upon.

    Gold – Having taken some profits (short) from gold last week we continue to hold a small position short. Expecting to add to shorts anytime this week. Net position of the commercials remains at a 5-year low. This will provide great momentum to a drop in the price of gold if gold price per ounce falls to the $1,200 region.

    Silver – Similarly with silver. We took some profit last week and continue to hold a small position short. Looking for a price climb to $1,730 before adding to shorts. Silver, however, has an even more dramatic picture on the COT as the net position of commercials is at a 10-year low. As with gold, any significant reduction in the price of silver will probably result in an exaggerated acceleration short.

    Intraday strategy – As an aside, much work has been done this week developing our short-term momentum strategy (namely using GBP USD intraday charts) on trading range breakouts and subsequent channels. I know this doesn’t make a lot of sense to the investor, but to a trader it is a high probability strategy with measurable risk and reward. And possibly the most lucrative of intraday strategies.

  • We take some profit from gold, crude oil and USD/CAD

    Until now we have traded the commodities: gold, silver, copper, crude oil and USD/CAD on a weekly basis. That is referring to weekly charts and a weekly COT report. We have also, as discussed last week, considered introducing the fund to intraday trading.

    Each of which (weekly and intraday) are rather on the extreme. On one hand, we have the overly slow weekly chart market, and on the other, the rather demanding intraday market.

    The balance for the fund is daily charts. Why? …weekly charts are emotionally difficult as we see good profit generated only for that profit to disappear as we remain invested in order to reach our target. There is no compromise here, because to take profit before a target, unless our premise changes, does not provide a traders equation (that is: the trade had more risk than reward).  Over the longer term this would be a losing strategy.

    Gold and silver have emphasised this over the last few weeks where they dropped in price to provide us with good profit potential, only to extend higher than I considered.

    Daily charts, rather than weekly charts, usually means tighter stop positions and therefore lower risk, but in contrast our targets are shorter. Timing wise we are in trades for a week or three rather than several months.

    The COT suits the weekly charts, but often goes against my daily chart readings. This of course happens at all levels of chart, for example, the difference between the daily and the 4-hour chart or between the  5-minute and the one-minute chart. However, I report weekly and to have a profit at the end of one week only to know that profit will go away as we wait for the bigger (targeted) profit seems emotionally foolish.

    With moving to daily charts, our targets are closer and therefore we can take profit more regularly (if available) and wait for the next entry. This means that we will occasionally miss the big move – but trading is rarely perfect.

    This week we took profit from our short in gold as it sank from its high of the previous week – and before Friday’s monthly non-farm payroll brought it up again. Also, we took profit from a short in crude oil as it came down over the week and from our long in USD/CAD as, conversely, it climbed nicely over the week.

  • Gold and Silver finish week on a high

    Silver finished the week on a strong move up. Silver is at, or slightly above, a three-year trend line. The COT shows the net position of commercials at a multiple year low; meaning the majority of commercials (the big buyers and sellers) have short positions on silver. As do we. Difficult to hold through, but that is the strategy.

    Gold provides, as it so often does, a similar picture to Silver.

    Crude oil ventures up towards the position suggested on my charts last week. A possible short on crude may present itself this coming week.

    USD CAD had little movement in weekly chart terms.

    Copper dipped early in the week and gave us a reasonable out position. Copper reversed back up by the end of the week as anticipated.

    The strategy on commodities is to go long or short reasonably early based primarily on commitments of traders (COT) information and supported by analysis of weekly charts. We use weekly charts as that corresponds to the weekly COT release. The COT is released UK time late Friday evening and is based on the previous Tuesdays collation of information by the CFTC.

    This strategy often calls for a significant period of time, several weeks or even months, where the trade is out of the money. Treat the COT as turning a large tanker ship analogy – it ain’t quick!

    To balance this ‘slow’ strategy we’ve decided to include a portion of the Slow Trader fund in our intraday trading. That sounds fancy, but is just a way of saying we trade with charts that are incorporated within the day. In our case 1, 2, 15 and 60 minute charts.

    In this instance we take as many as 9 to 15 trades a day and normally complete all trades before the end of the day. I’ll discuss our strategies for intraday trading in next week’s blog.

  • Copper, Gold, Silver, Crude Oil and USD/CAD this week

    Copper has had a strong week and finished high. Silver in particular has spiked up. Gold also increased but finished the week more or less even. Crude oil has finished the week reasonably strong. USD/CAD is still some way from turning up and will need careful management.

    Here they are in slightly more detail:

    Snip20160423_2

    My premise on Copper has changed. Copper, I feel, is some way from a big turn down. I would consider a small increase in price before a drop to our low 2 weeks previously – and then a possible climb. We will look for the best price to exit our copper trade.

    Snip20160423_4

    Silver has had a dramatic couple of weeks. Two strong weekly moves up taking silver from the one year trend line to the, higher, 10-year trend line; indeed, the price of silver bounced exactly off this line – marked with a circle. Always difficult to short when everyone else is long. But that is exactly what we did. Of importance, and supporting our case, the COT for silver shows commercials at an 8-year record with the number of shorts compared to longs. Hold onto your hat!

    Snip20160423_5

    Gold has not been as dramatic as silver. Up in price all week, gold finished low for the week supporting our prediction of gold progressing further down in price over the coming weeks.

    Snip20160423_6

    I’m a supporter of a drop in price again in crude oil, but it may take its time. Price possibly getting to somewhere marked by the red circle. For now, we remain on the sidelines.

    Snip20160423_8

    USD/CAD price mirrors that of crude oil. Therefore, a trade on both is double the risk and a significant consideration. As with crude oil short, it is early days to consider USD/CAD long. A turn somewhere in the green box however is a good probability. But risk reward is excellent when we catch a trade early. Probability is the other major player in the traders equation; moreover, good management of early trades is essential.

  • Slow Trader Trades

    In our fund (Slow Trader) we recently invested short – that is to say, we want the price to go down – in Gold, Silver and Copper. (This strategy is a one to three-month trade, but varies slightly for each commodity). 

    Fund exposure is currently £70,738 (we are leveraged)

    Silver stop risk is £1,953 – between 4 trades.

    Silver target is £4,633 – between 4 trades.

    Gold stop risk is £1,252 – on one trade. (A limit order is in place to short more if gold price rises).

    Gold target £2,518 – on one trade.

    Copper stop risk is £1,929 – between 2 trades.

    Copper target £2,918 – between 2 trades.

    We use the Commitments of Traders (COT) report to give us a small edge. The COT is, other than cyclical analysis, probably the only indicator that is not price based. And, therefore, an independent view-point. We combine the COT with our own technical analysis of each commodity.

    Here is an example of the COT released last night. The same information is available for each of our commodities. My attention is on what Commercial is doing.

    Snip20160319_6

    The importance of getting the technical analysis right is due to the COT being in lag by nearly 2-weeks. Which, based on our strategy, is between a half and a quarter of the expected trade duration. In other words, we need to use a good amount of interpretation (and rely on technical analysis) for a significant chunk of the trade time.

    More specifically, COT figures are from each Tuesday but are not available until late evening (UK time) on the following Friday (i.e. 10 days). As the markets are closed till Sunday night (UK time) it puts the COT information nearly 2 weeks old. But even with that considered it’s still the best, broad, indicative information we have – other than our own technical analysis.

  • Do fundamental and technical analysis mix?

    Of my fifteen years of trading the first ten years were spent on reading fundamentals. I don’t regret this one bit. Fundamentals are what drive the price of a stock over the longer period; and I do mean longer period. Fundamentals to me are great if we’re talking more than 20 years, and I prefer 30 years plus.

    However, for clarity over the near term (presumably from my thought above, near term is anything less than 20 years) technical traders hold the key. That is a bold statement as every magazine or commercial pundit tells us its fundamentals all the way.

    Can we combine both technical and fundamental? Yes, of course, and some traders report to be doing this successfully. To some degree, I do this with the Slow Trader Fund when I trade from daily charts. In this case I will take commodity trades when the COT report is in agreement with the trade. However, the fundamentals of a stock do not mix well with technical analysis over the shorter period. One simply confuses the other, and that is never a good basis for a successful trade.

  • Weekly Diary – Slow Trader Fund

    A week of lessons and some missed trades.

    A few areas that I’ve traded this week have been disappointing. Not by judging the trade correctly, far from it, that has been good, but by being stopped out too soon. A novice trading error possibly. It’s a great lesson to take forward.

    Here are the trades in question:

    Silver. We had a good ‘short’ signal for silver. Both on the chart and the COT. The COT was a little early, so I set what I considered to be a good size stop. A stop is the exit point, the point at which we get out and accept our loss if all goes wrong. Notice on the chart below how the price climbed to almost the exact position of my stop. A stop twice this distance with a reduced trade amount was the answer. We may have a second chance if price retraces as I’ve indicated with the blue arrow.

    Snip20151030_13

    Notice the COT below for silver. It is at a 3-year low shown by the blue line. Once this turns up, and remember that the COT is big picture only, this will support a short for silver. Gold has also come down with a similar, although not quite so pronounced, COT picture.

    Snip20151030_14

    EUR USD. The currency pairing of EUR USD is one that I trade day-to-day. Notice how volatile this currency has been of late. I have provided the 1-hour chart to illustrate this by showing several recent spikes up.

    Snip20151030_18

    The spikes may not look like much, but to a day trader (trading an intraday chart) they are a challenge. Again a significant stop distance (about 40 pips) is necessary. However, this makes for difficulty achieving a traders equation of 2:1 on a 40% probability trade, which is the minimum requirement for most swing trades.

    Crude Oil. A wide trading range has developed for WTI. The Price of WTI moved down to coincide with the top of the first daily breakout. An expected phenomenon . The (buy) signal, although bearish on the daily chart, was good in hindsight; however, I will look for a second entry opportunity to go long if price retraces back to the lower trend line and again provides a good buy signal. After that, I’d expect price to climb to the top of the channel that I’ve drawn with a 40% or 60% probability of ascending or descending respectively.

    Snip20151030_19

    We remain in Ashtead Group PLC with a target shown by the blue arrow below.

    Snip20151030_20

    Finally, A reminder that Slow Trader values will be provided every first Saturday of the month.

  • Weekly Diary – Slow Trader Fund

    Snip20151024_2

    Ashtead Group PLC (AHT) was a good buy for us, so far. The buy was at the bottom of a trading range, as we can see above. This has a 60% probability of climbing to, or near, the top of the range indicated by the target arrow. Of course, there is a 40% probability that the price will break higher from the trading range top. However, we have taken this for a ‘scalp’ rather than a ‘swing’. A swing would be where we would allow the price to retrace before going (hopefully) up higher. A scalp, on the other hand, is generally a movement from one extreme of a range to another without a retrace.

    Snip20151024_4

    The picture for crude oil, WTI, has changed slightly from my suggestion last week. The COT, shown above, only works with some degree of sureness when it is in harmony with the trend. The little turn up, that we can see at the very end of the blue chart line above, represents a downturn in the price. That tiny turn up represents about two weeks of price movement. I like to keep the COT on a 3-year chart as I find this best for perspective. COT, we may recall, is big picture stuff only. And, again, is only to be trusted when in unison with the trend. Which, in this case, it is not.

    Snip20151024_6

    Above, is the daily chart for crude oil. My own thought, is a move upwards soon, as indicated by the blue arrow, to provide a wide trading range. The price tried to turn upwards last week but failed. For another turn up we will need some price action confirmation supported by the COT.

    Other activities include an introduction of swing day trades on the FX market in EUR USD. In day trading I find it benefits greatly to concentrate on one market. I scalp and swing in my personal fond on day trades. Slow Trader, for the time being, will be swings only in day trading respects. Swings tend to be lower probability trades, about 40%, but have bigger reward potential. They are also less intense to scalps. We will see how this progresses for the fund and, of course, I will keep you posted.

  • Slow Trader Diary – week 39

    We remain just above even. No trades taken this week.

    The week was spent trading small amounts with my personal fund (£1 per point in the currency pairings).

    This gives me the chance to work through, and live trade, many of the lessons from the holiday modules with small risk.

    It would be silly to just jump straight in. Trading is like any other demanding job, you need to work your way back in after a break.

    Slow Trader is daily charts and therefore not day trading; however, the day trading techniques I use in my personal account are the same for slow trader with the daily charts. What I do in one day with day trading takes a week or so using daily charts. However, daily charts are more defined to my mind; and, as I trade much larger amounts through the daily’s, I need to be on my game. Daily’s are my prefered charts.

    Due to the China situation, both the S&P and the FTSE have seen a large drop since August. That will be reflected in individual stocks and shares of course. I am watching the S&P for a turn.

    Snip20151003_2

    Commodities to keep an eye on:

    Coffee price is at a 10 year low. The COT report supports an increase in Coffee but it’s early days. As coffee price increases we can look to see what effect this has on coffee companies such as Green Mountain.

    Gold is at the same price that it was in 2009. Gold price remains uncertain. The COT is a buy and gold shot up yesterday in reaction to the US nonfarm payroll monthly report. From our point of view, however, gold is now a wait and see.

    Crude oil is, as we all know, at a significant low. The COT is at a minor buy stage. However, the trend down for crude is so strong we would need to see an established move up before considering buying. Most amateurs will buy crude thinking it can only go up…..not sure about that one. I certainly would need to see evidence first before committing. Okay, we miss the very bottom and therefore maximum gain, but to try to find the bottom is very weak in terms of probability, actually it’s foolish.

    Currencies:

    Those not thinking that we live in a global economy should have watched the nonfarm payroll at exactly 1.30pm yesterday. The results were not favourable to the US and most major currencies (including the S&P) moved, simultaneously, the price difference of a big trading day in less than a few seconds. Eye watering stuff.

    As a trader the above shows the importance of knowing the big event news item times. I do not trade the news, for me the probability of getting it right is too low.


  • Slow Trader Diary – week 35

    We are open with gold.

    Broker charges for the week were a credit of £9.48.

    Here’s our gold trade:

    Snip20150829_1

    Our target is in the region of 1212. This is in-line with the COT and if the present Up continues it will nicely form a recent Up (or recent trend upwards). However, as we have seen this week, the market remains volatile.

    Of the other trades we considered earlier in the week:

    Silver moved down lower than expected, did not provide price at a level I could determine. So no trade.

    Snip20150829_3

    NZDUSD remains a possibility to go up briefly. But it is presently stable below its low of recent weeks. It may move up soon. However, this is an advanced trade as it is against the big trend and is without a recent Up.

    Snip20150829_2

    GBPUSD, having been quite stable through the initial turmoil of the week, just blew down. It may turn at the 15350 region or continue down to as low as 15190. I’m less convinced of this trade. It has, for now, become choppy which always makes for a difficult read. The COT is still a buy but is weakening, we do not have a recent trend, although the mid trend remains up. Only excellent (daily) price will convince me to take GBPUSD at the moment.

    Snip20150829_5


    EURUSD is approaching our predicted bounce point. However, the COT is about to turn and we are all aware of the volatility presently associated with the EUR. My own thought is that the bounce could happen but it will be short lived. Price may turn down again before the previous high thus establishing a recent Down (or recent down trend).

    Snip20150829_6

    WTI, or crude oil, bounced off its lower stop this week. This move is gently supported by the COT, nothing dramatic for the time being. Too early to decide, but it is on the watch radar now.

    Finally, the S&P and FTSE have moved up slightly, but the roller coaster might not be over yet.

    As I’m away for a few weeks the next diary will be 26th September.

  • Wonderful opportunities

    Difficult times in the trading business for the longer-term investor.

    Wonderful opportunities for short-term swing traders, if we get it right.

    I sat on the side lines as the markets slipped recently. Unable to take advantage of shorts (trading the market to go down) as it all happened so suddenly. The large dips in FX (foreign exchange pairings) occurred, in those I monitor, within a minute.

    There are after shocks, so timing any recovery is interesting. Those that I will consider are:

    Snip20150826_35

    Silver. At some point soon I consider Silver will rally, short term. However, recent Up (or recent trend) is against us so a buy to go up becomes an advanced move, meaning the buy signal needs to be clear.

    Snip20150826_36

    NZDUSD is firmly down on the long trend. The COT is a buy, but we have to be careful with the COT signals when the COT is going against the longer trend; the COT, in this instance, still often works but can be short lived. Having said that, there is a (possible) short term buy opportunity here.

    Snip20150826_37

    I’m looking for a buy in gold at about 1125 price with a good buy signal. Catching the signal with the correct buy: on-market, on-limit or on-stop is key.

    Snip20150826_40

    GBPUSD has been relatively stable over the last few days. A retrace to the 21-day moving average (MA) is worthy of consideration. It may happen quickly, if at all.

    Snip20150826_41

    EUR might strengthen again soon against the USD. Unless I get (daily, or, at a pinch, 4-hour) price action at a support level I will not take this until about the 1120 level.

    Snip20150826_44

    Finally, the S&P 500. This, I find, is possibly the most difficult to judge. With the recent dip the S&P could provide a good gain on a bounce. A buy in the region of 1836, but could go down further to the 1770 region. Good price action, or whatever is your chosen price criteria, is important here.

    Lower trade values and generous stop positions are considerations when volatility is high.

  • Slow Trader Diary – week 34

    Here are the ups and downs of this week:

    Pace PLC lose £294. AUD/JPY lose £770. Silver gain £363. USD/JPY gain £115. EUR/GBP gain £523. Broker cost was a gain of £18 (the gain was interest earned as we were up with USD/JPY for several days).

    Net for the week was a lose of £45.

    The (unexpected) last minute strength of JPY took away a potential two grand gain for this week. That is how it stood financially. In ‘how well we traded’ terms I was pleased with this week. We called the market correctly in everything but a late dip against JPY. That is the nature of the business.

    The main area for improvement is the risk/reward amounts. We didn’t manage better than 1 to 1. To make money consistently, this needs to improve to an average of 1 to 3. Or, as we term it, 3R. That is: wins need to be, on average, three times bigger than the losses.

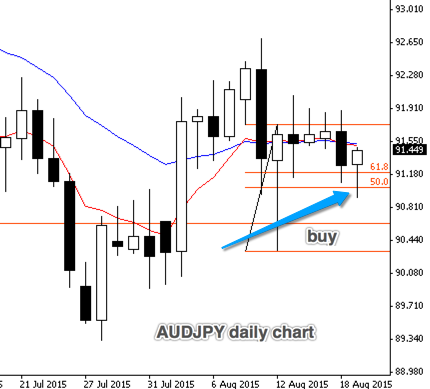
    Take AUD/JPY above for example. Our stop was 110 points (often called pips) away. That means I felt that the trade had the possibility of going up at least 330 pips. Three times the risk. Or, 3R. If I didn’t, I more than likely would not have taken the trade. Its a necessary filter to keep the risk reward balanced in our favour.

    The important reason for this is simple. At 3R we can lose some 60% of the time and still take a profit. Okay, it will make it hard work, but a profit non the less. We aim to have the statistic the other way round and win 60% of the time. Importantly, however, if we are not achieving an average win of 3R – we lose longer term.

    So keep an eye out in future for the ‘R’ which I will post after each actual win/loss. If you see 1R consistently on the wins you will know (nice as it is to have a win) that we are not cracking it. However, an average of 3R is plain sailing.

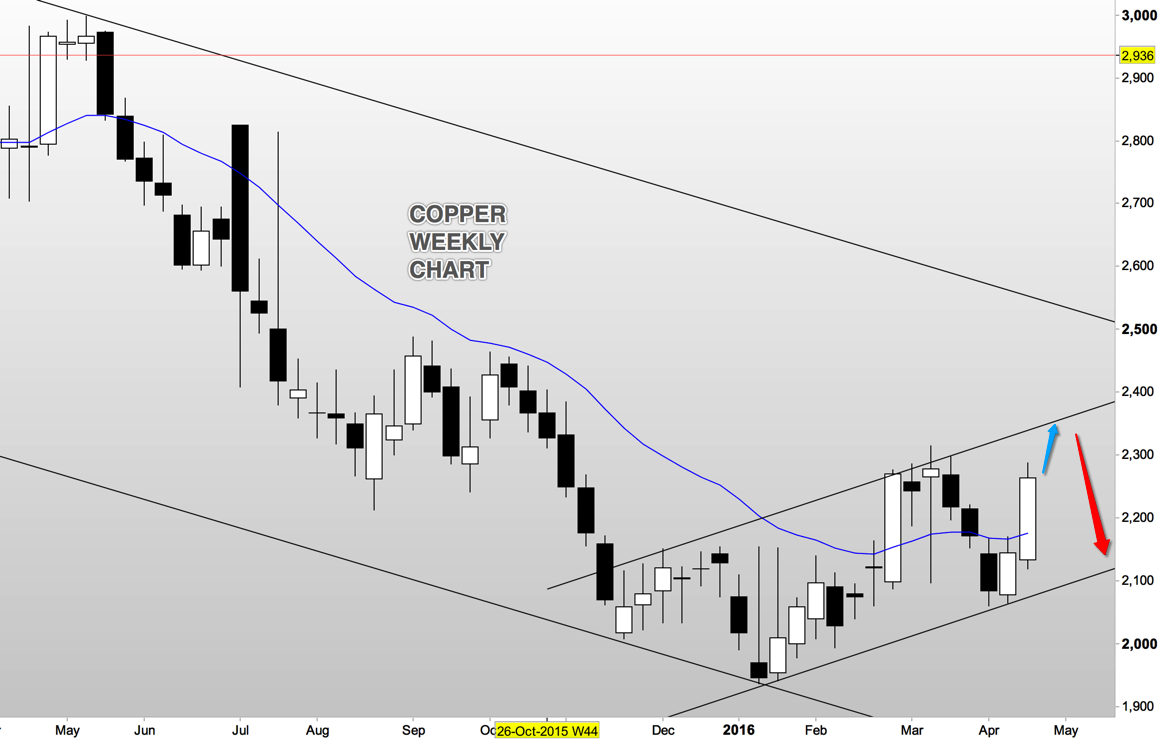
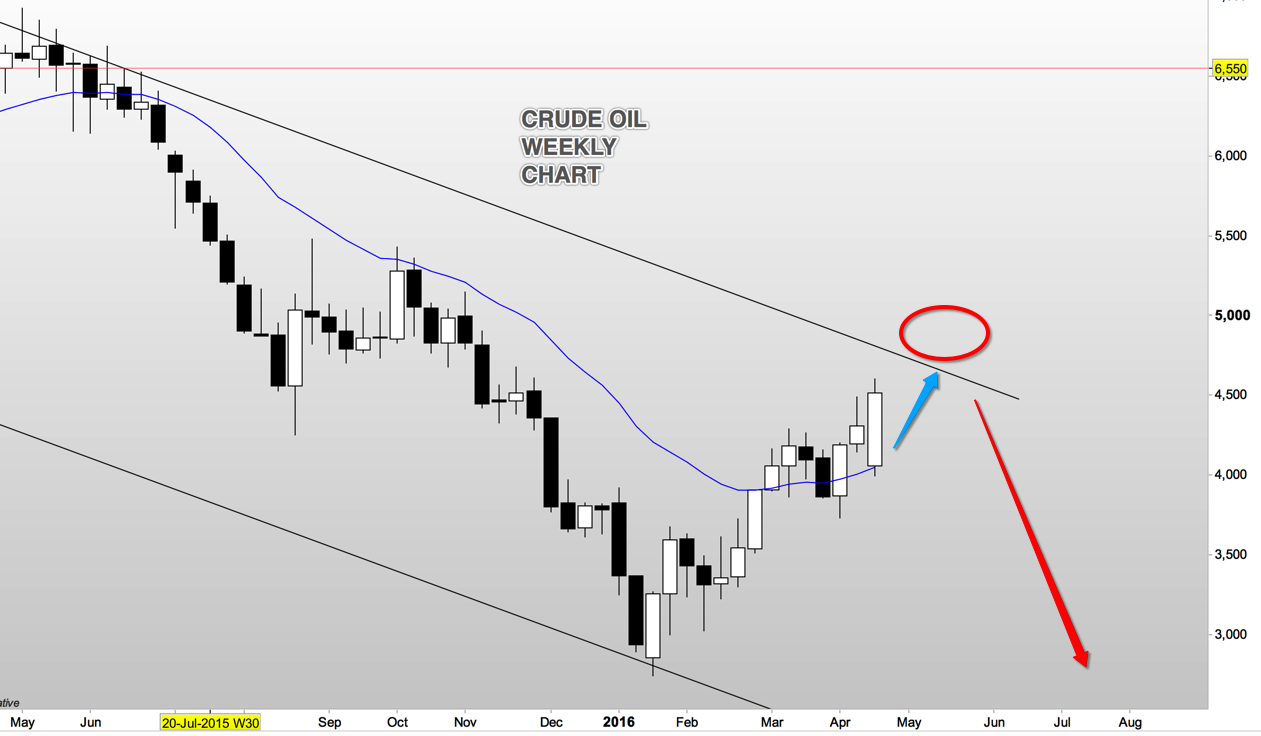
    From this weeks charts:

    Snip20150822_26

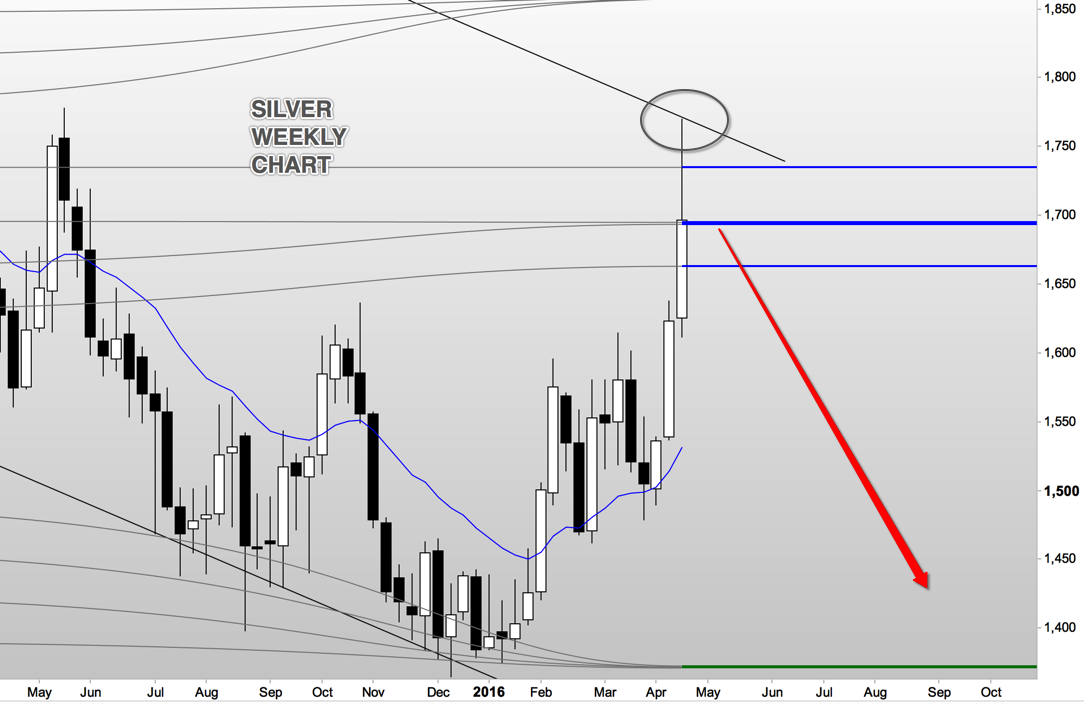
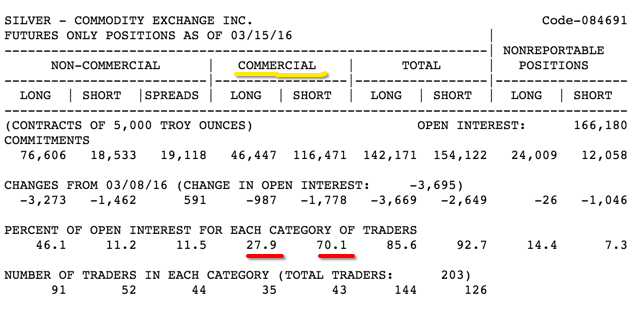
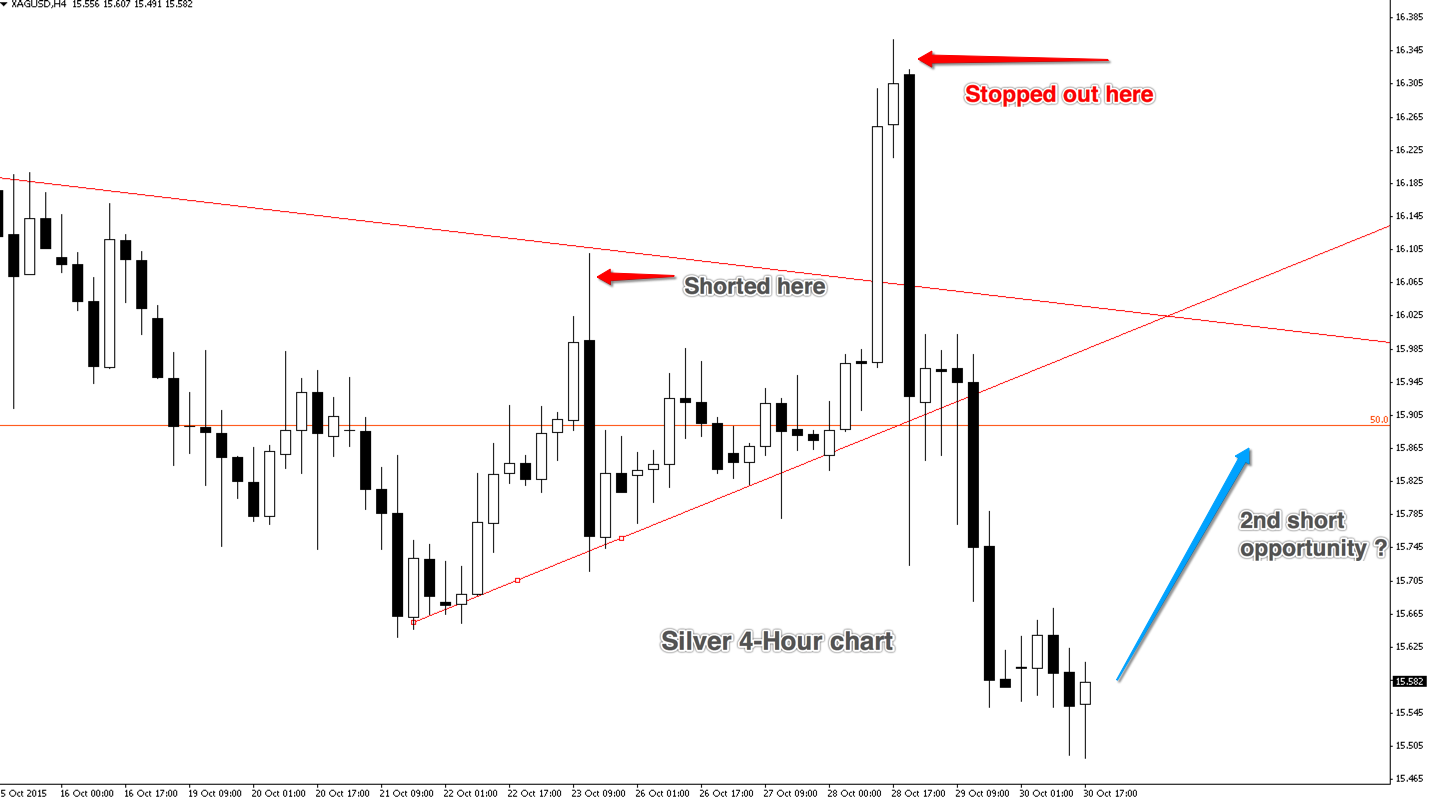
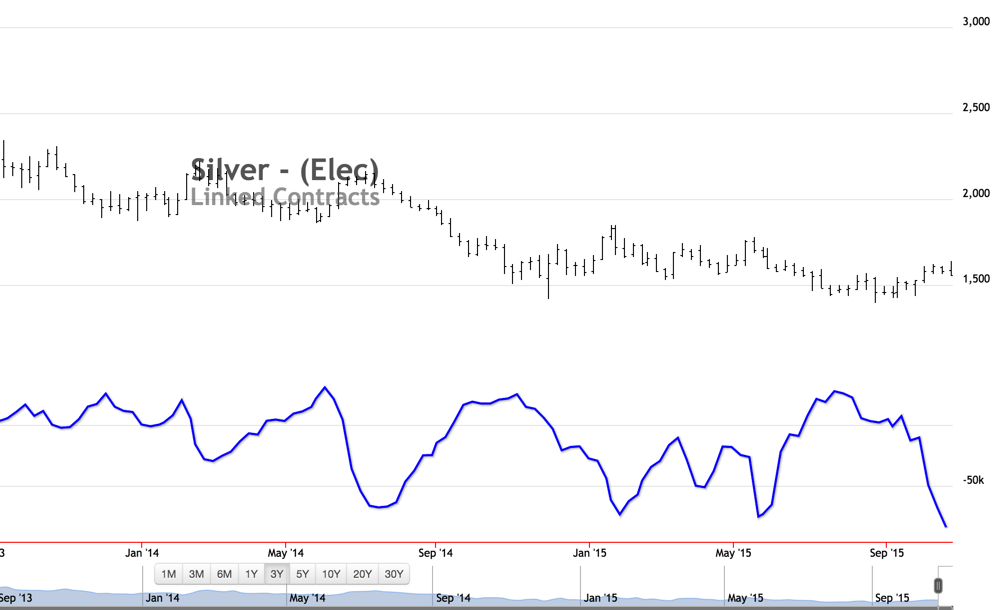
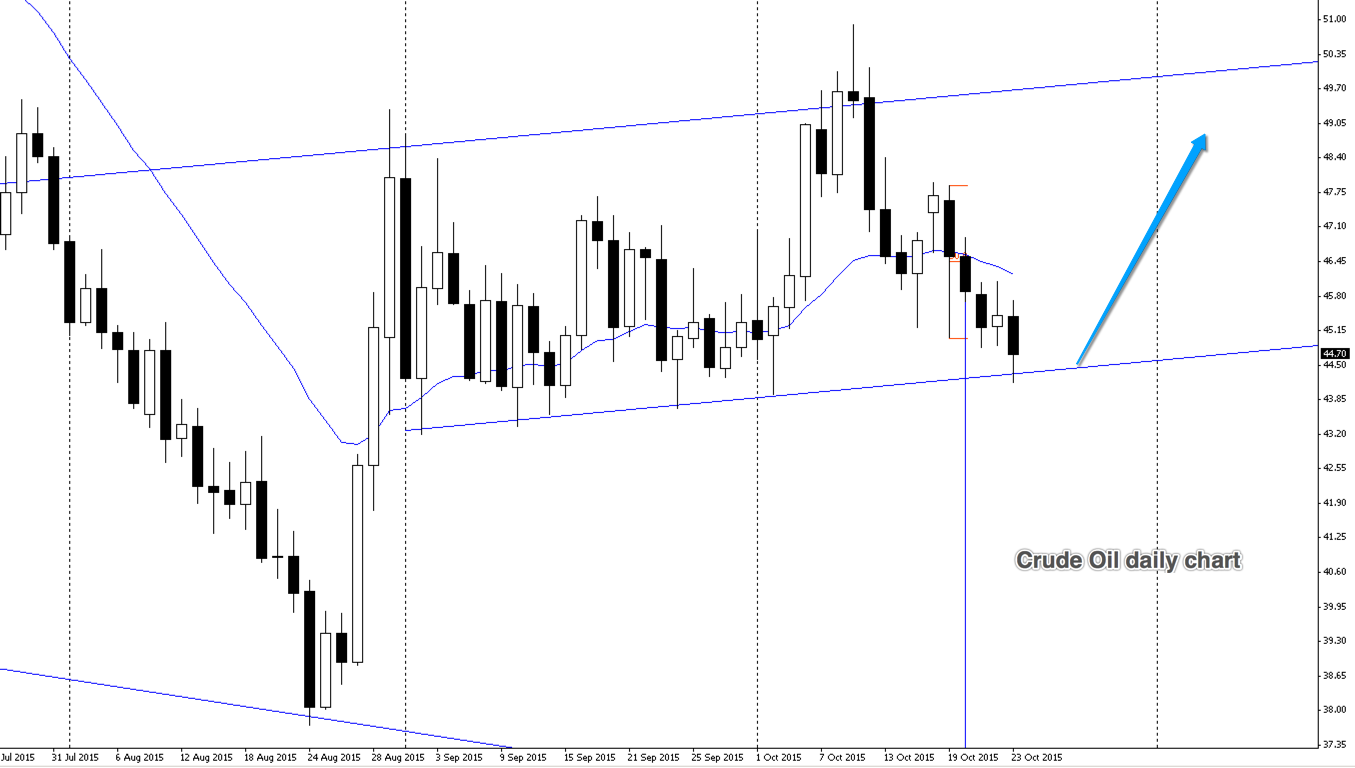
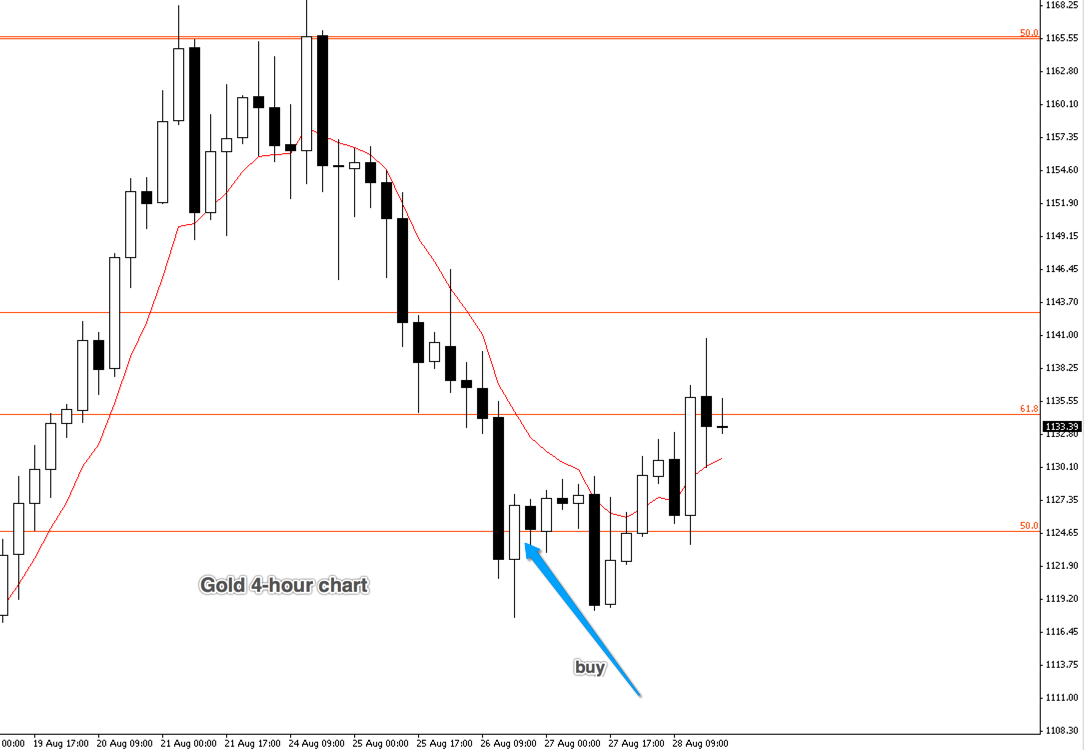
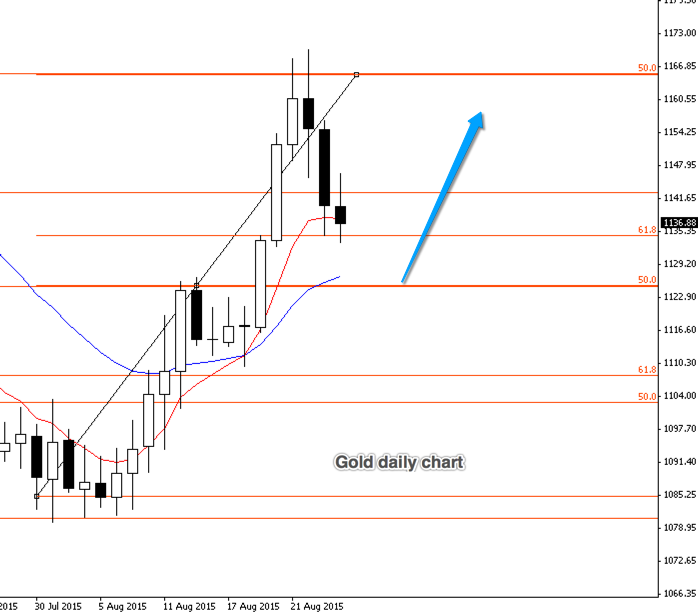
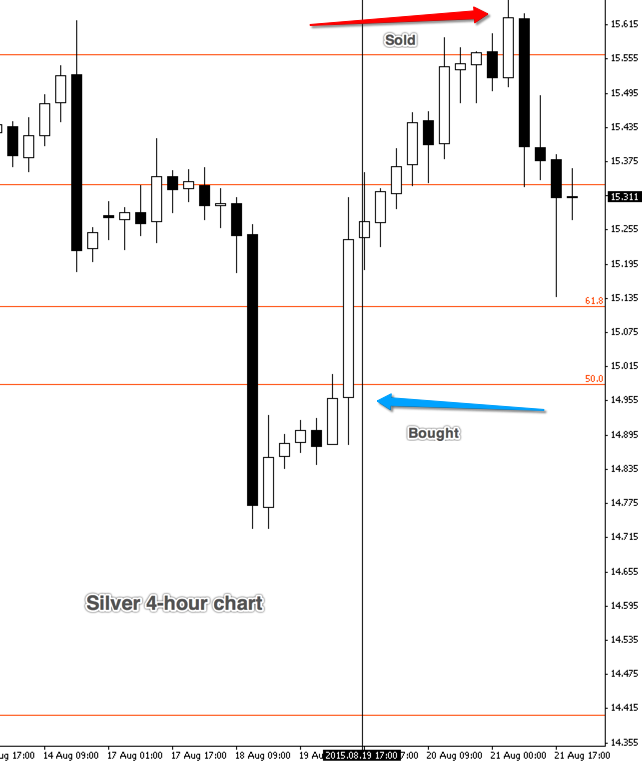
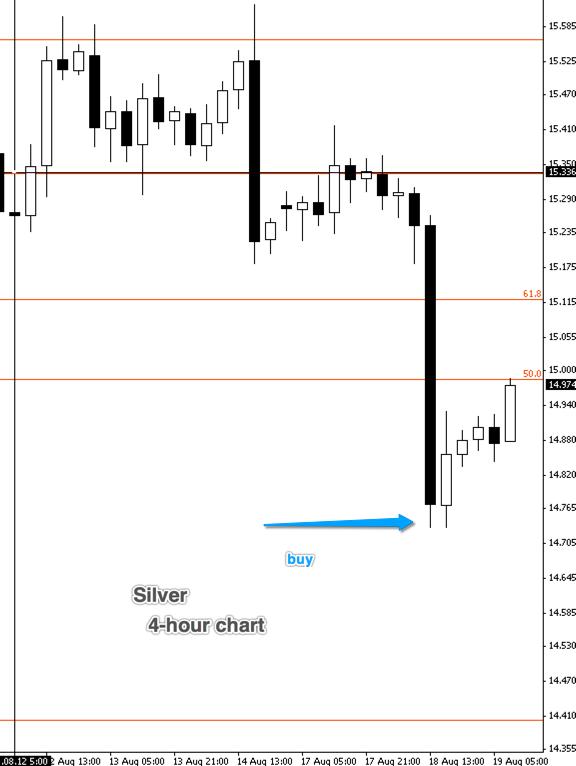
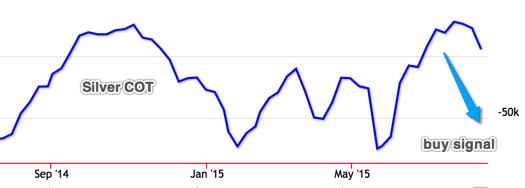
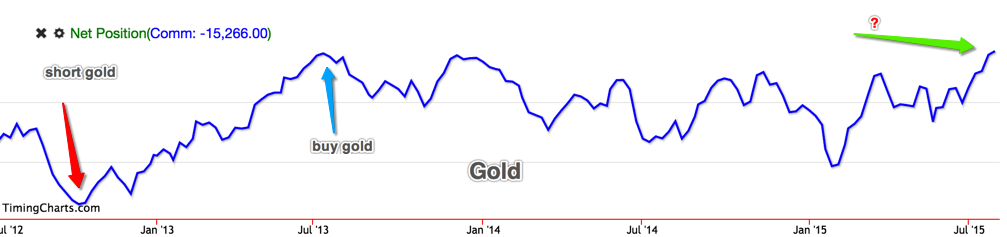
    We know from the COT (commitment of traders) report that gold and silver were ready to buy. We had to be careful however of the long term trend against both of these commodities. Therefore we waited until, in this instance, silver went up and retraced to provide a buy opportunity in the direction of the COT, but also with a recent Up (a recent trend up).

    Very nicely done. I came out – correctly – at only 1R because the overall trend was still too strong on Silver. We may get another buy opportunity this coming week.

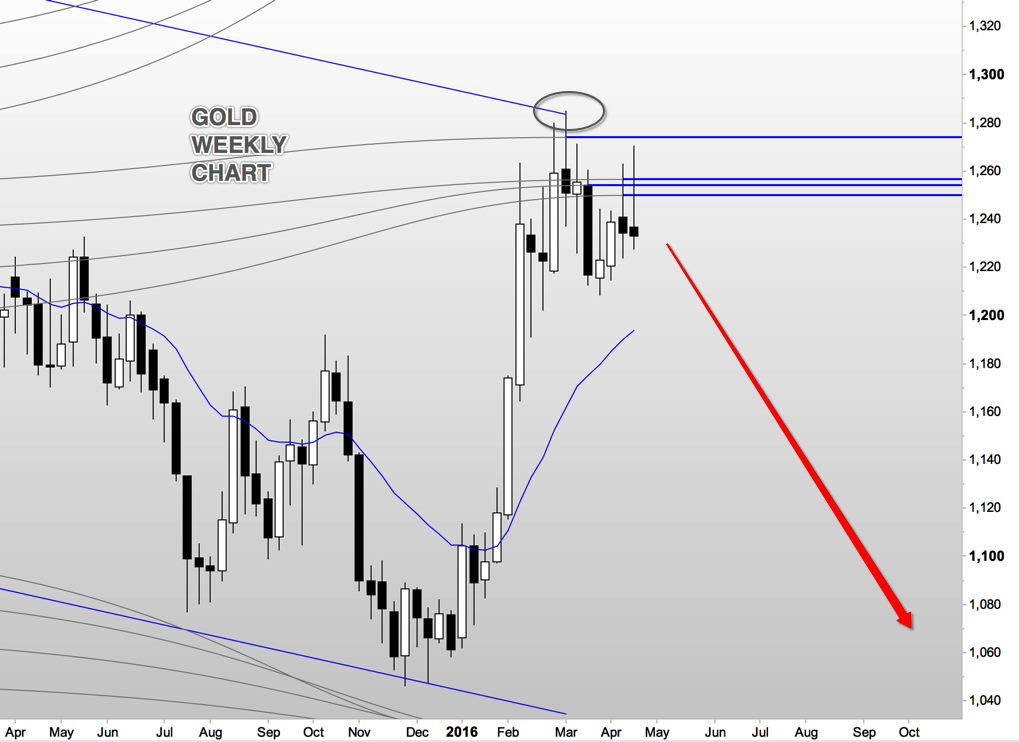
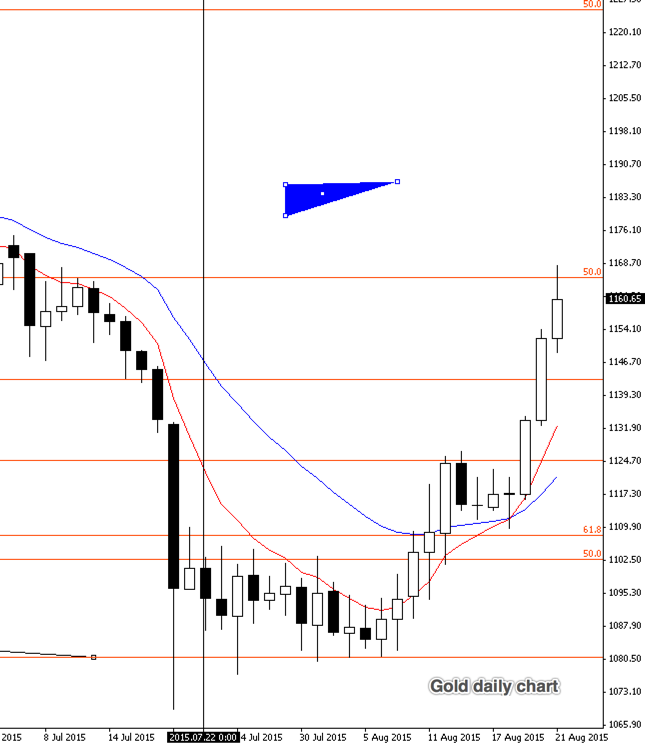
    Gold, on the other hand, did not retrace and I was left watching it go up – even though I knew it was going up. There are strategies to jump onto the train and, influenced possibly by Silvers retracement and thinking gold will do the same, I missed one. Still watching.

    Snip20150822_28

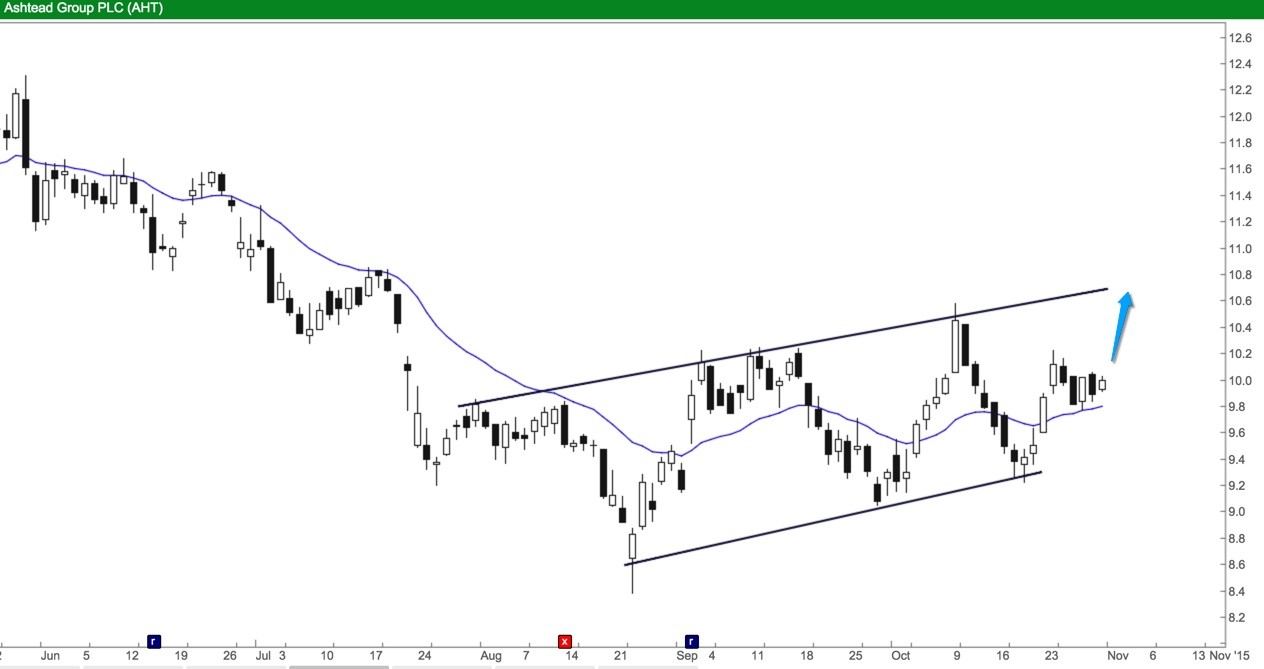
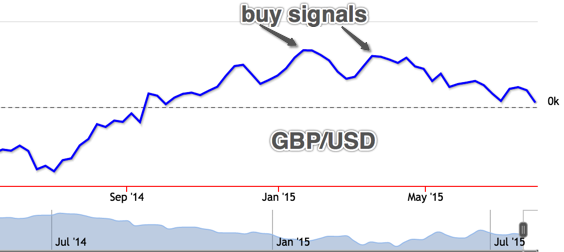
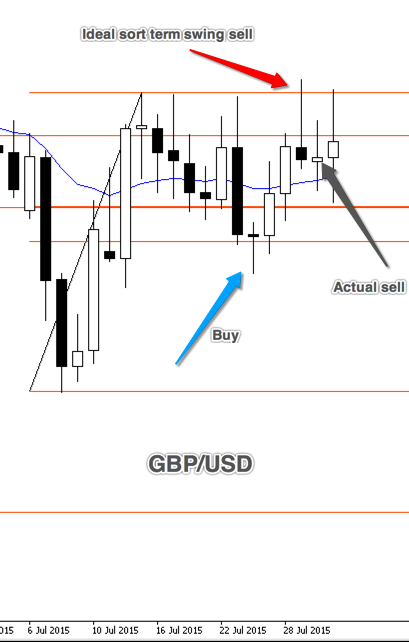
    There are clear buy signals above. And signals to jump on board. Hindsight remains wonderful!

    Snip20150822_30

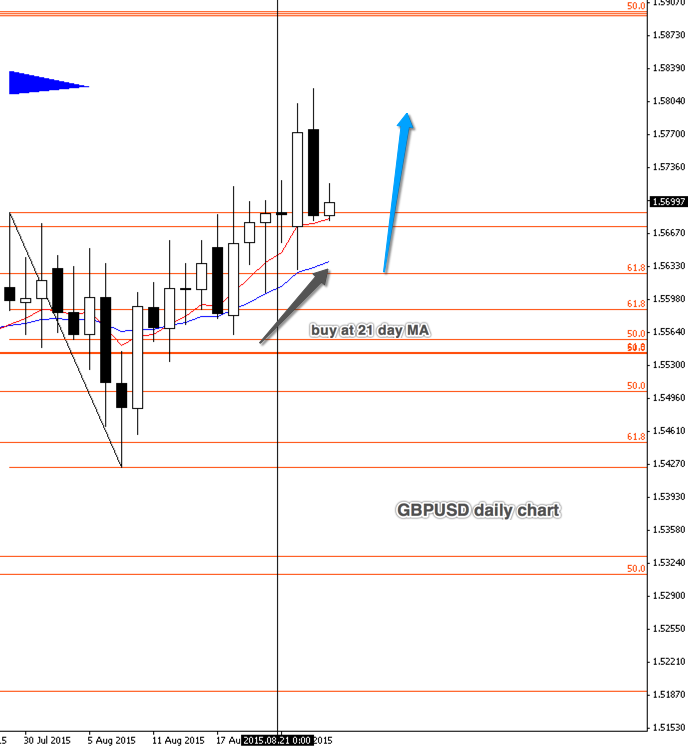
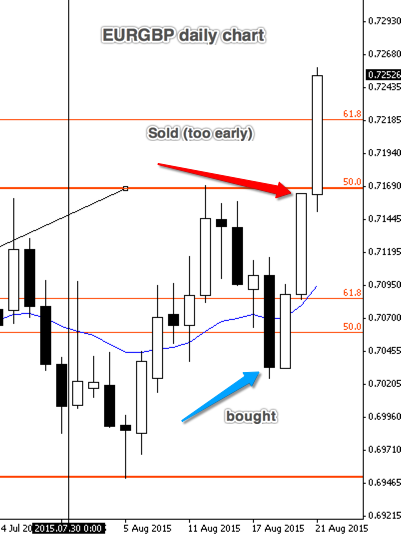
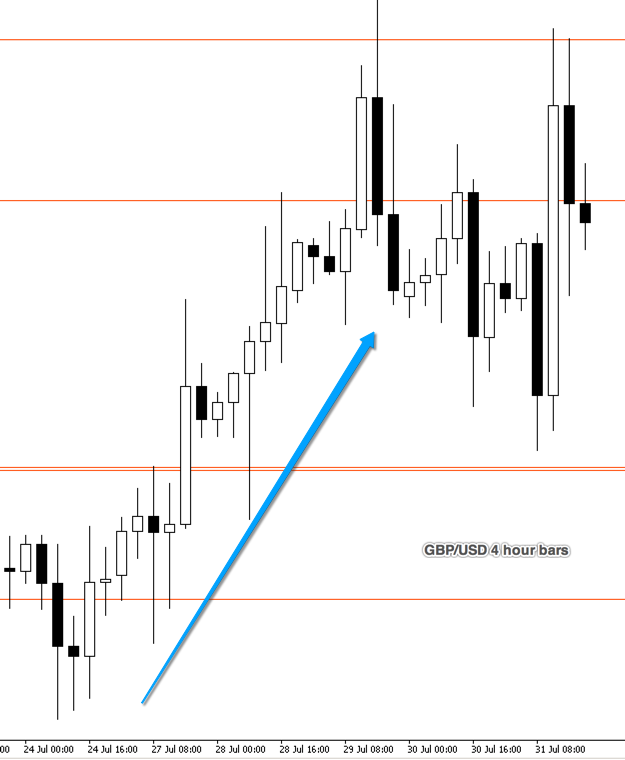
    Sometimes we can just plainly do better. I’m pleased with that EURGBP buy above. It was an excellent call, if I say so myself, however, I came out way too early. At only 1R. You get the picture. Why did I come out at 1R when the market for EURGBP was going so strong? that, as we have already mentioned, is the area for improvement.

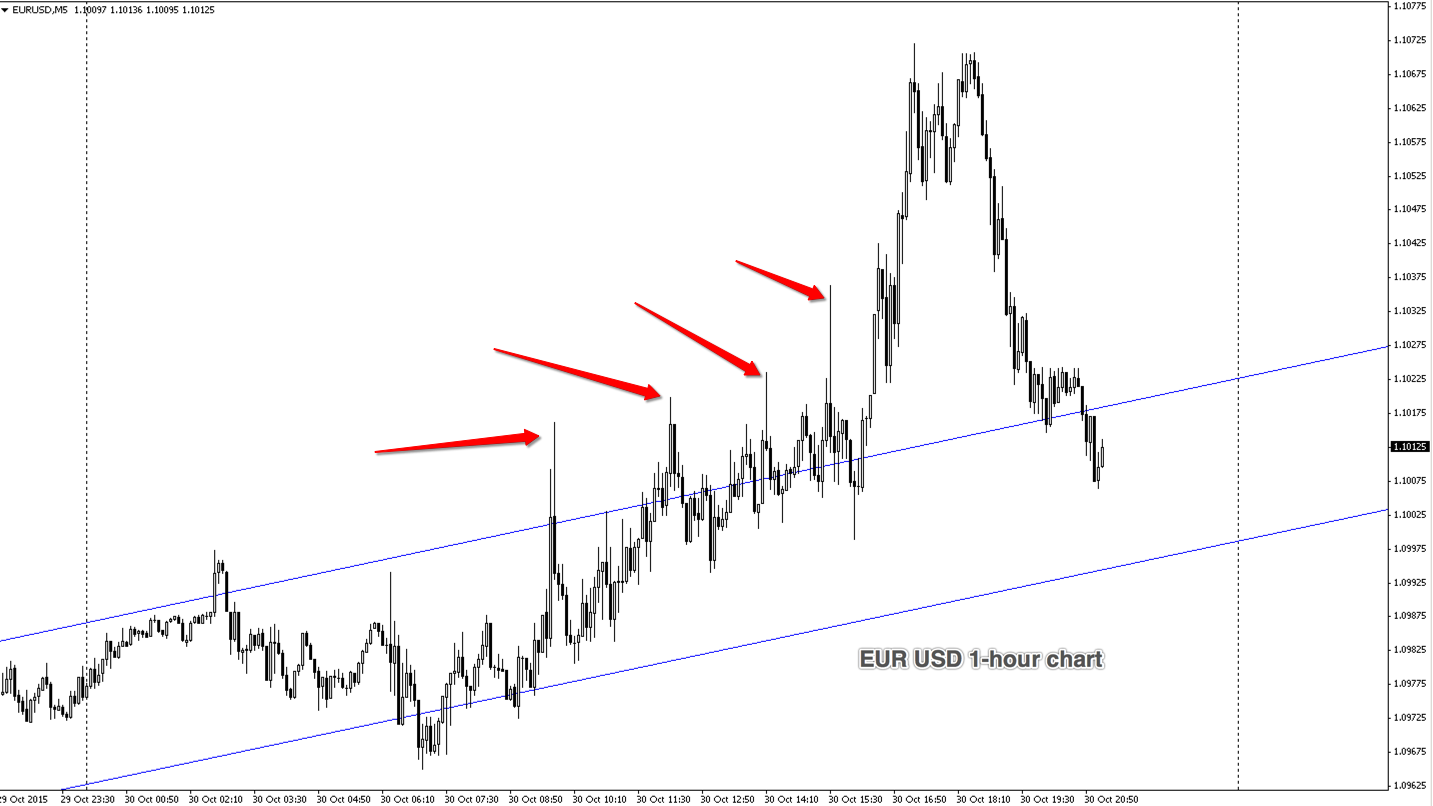
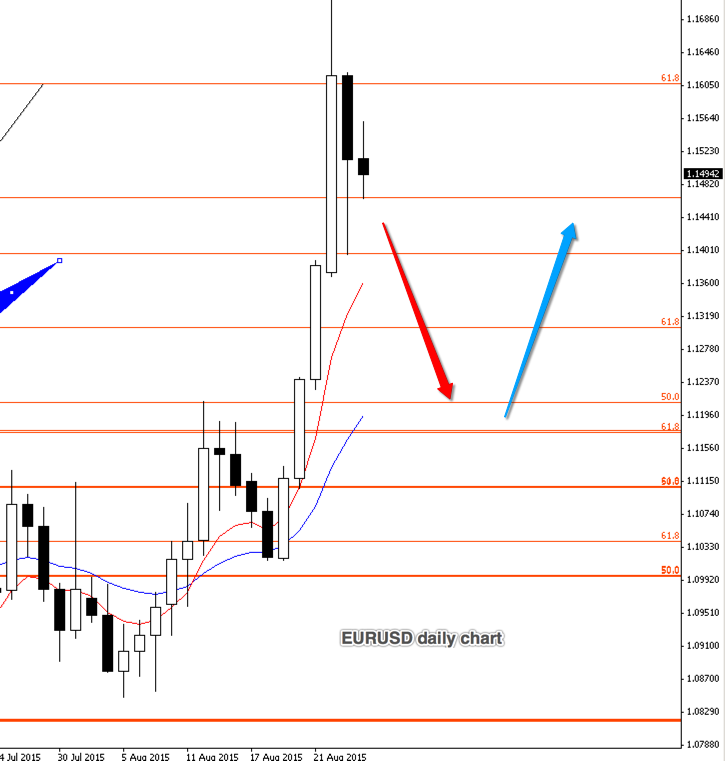
    I had a buy order in place with EURUSD and missed a great buy by only a few pips, the chart then zoomed up. But I’m happy with that as the trade (although missed marginally) was correct.

    Snip20150822_32

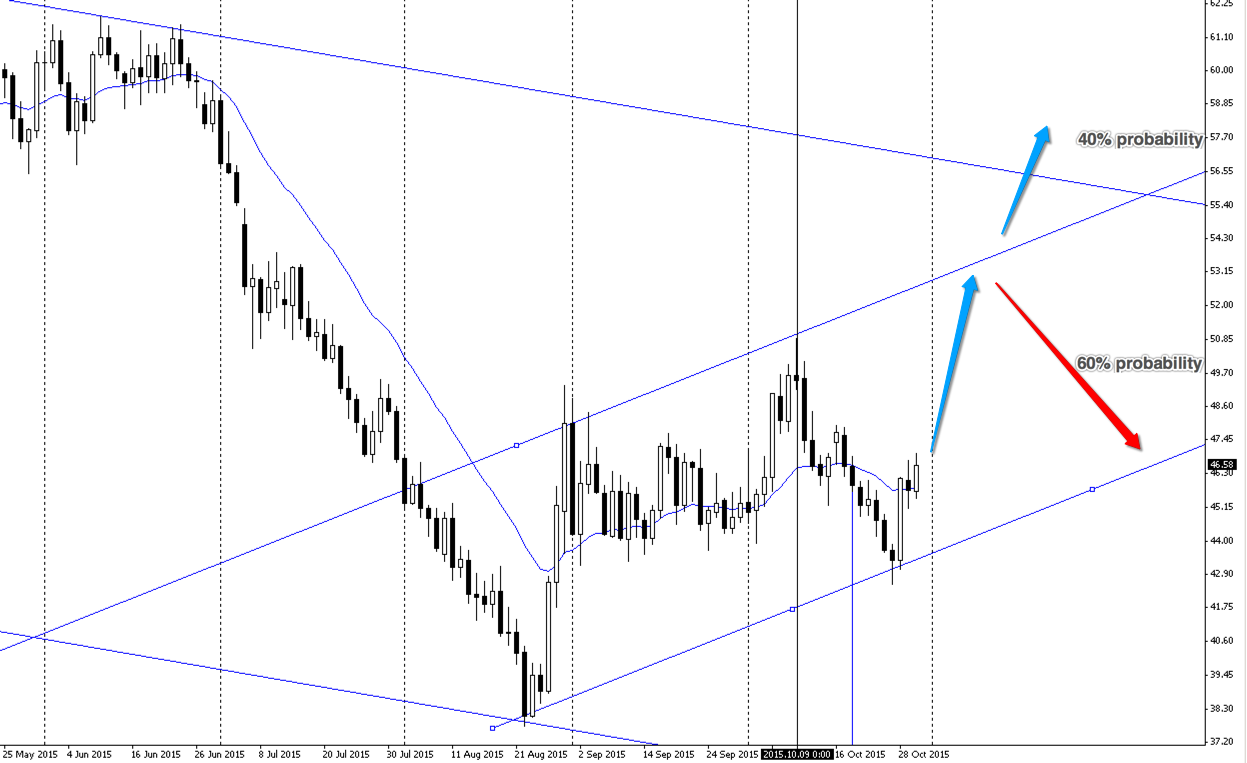
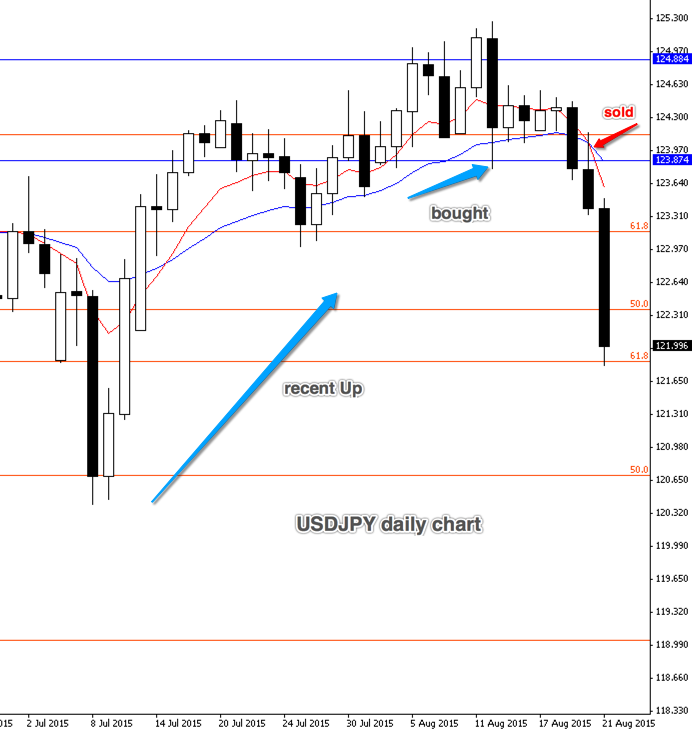
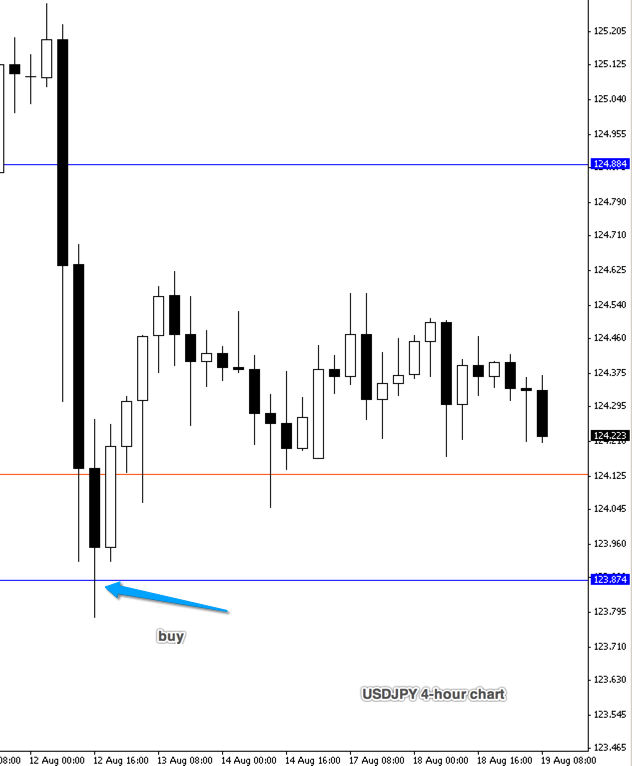
    USDJPY above, was this sell instinct? I bought USDJPY on a retrace, from a recent Up, on the one hour chart (chart above is the daily chart to show the week). I was looking for a 3R with this one and we sat at 1R all week. I noticed the move down (unexpected strengthening of JPY) and sold with a small profit of £115 (all week the profit had been £600).

    The interesting thing about trading is the necessity to detach yourself from profit. Personally (although I’m background aware, of course, of the profit) I never look at ‘up or down’ in terms of money (I don’t even have the money amount showing on my broker page) but only in terms of ‘pips’. If we’re emotionally attached to money amounts – up and down – we cannot trade emotionally detached or to the best of our abilities, consistently, over the longer period.

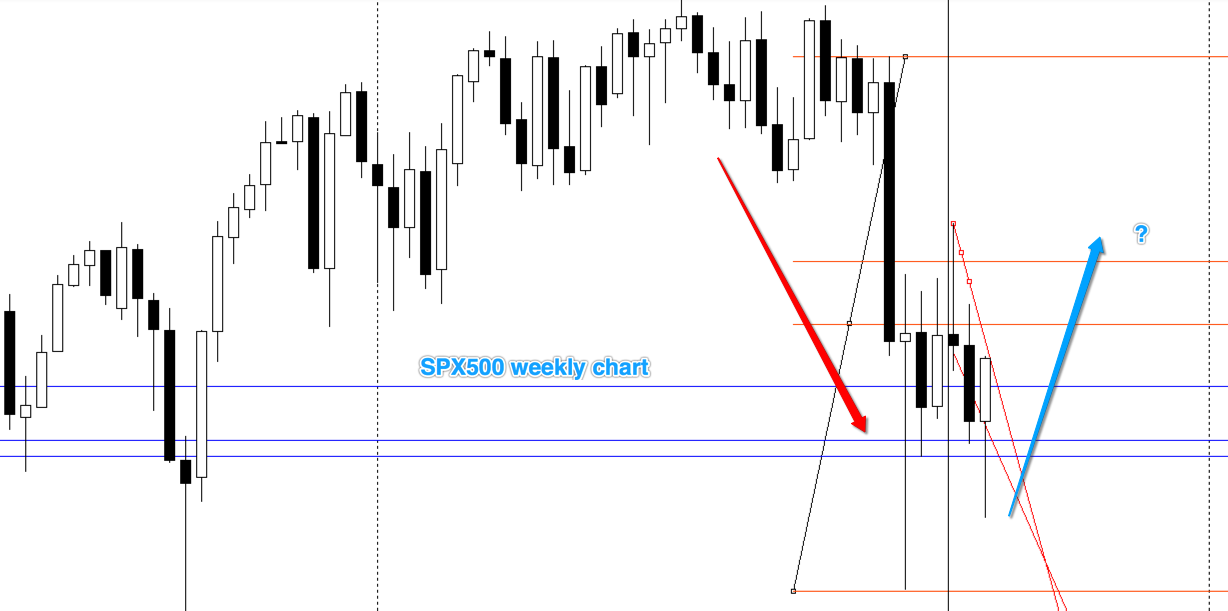
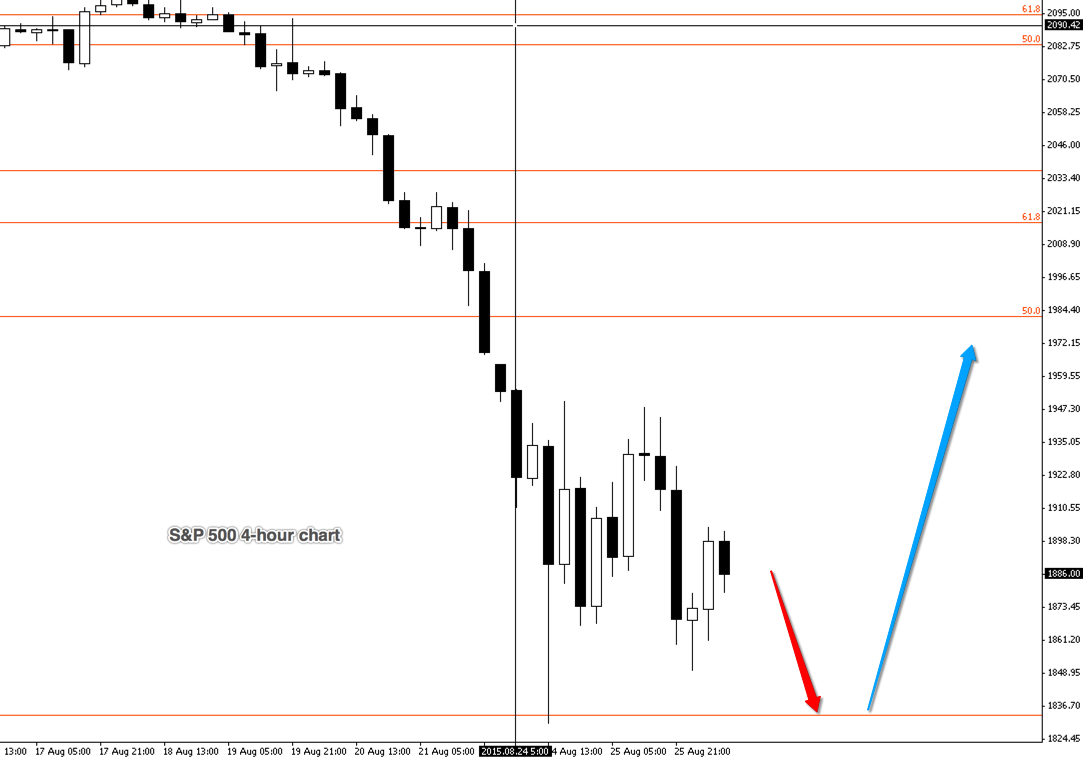
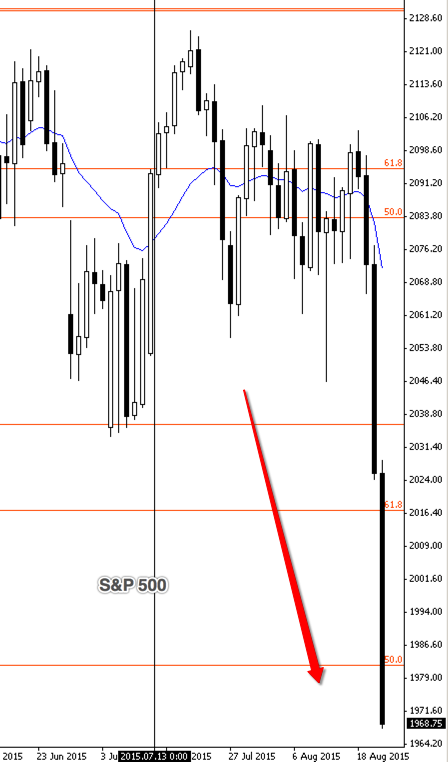
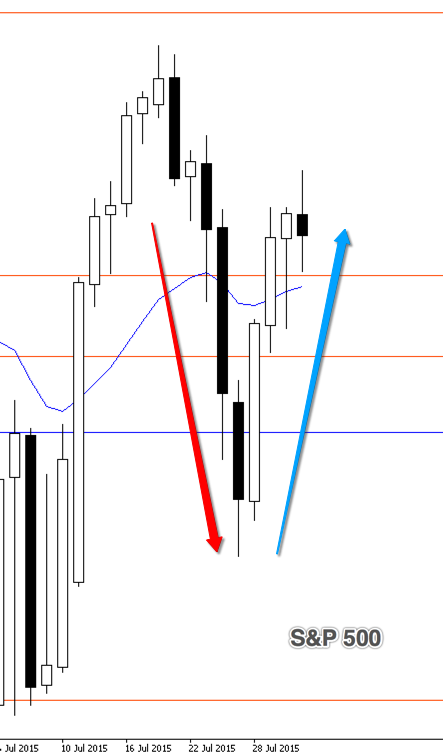
    Worth a mention about S&P below and FTSE.

    Snip20150822_34

    For those in traditional funds they would have taken a battering this week. The FTSE is a similar picture. I realise that those in managed funds, for the long term, then this is only a 20% blip downwards. However, I would like to take the 20% back up, without having suffered the down bit.

  • JPY does not play well with the COT

    Some good opportunities in the foreign exchange pairings (FX) this week.

    I am more and more concentrating on the FX market rather than the stocks and shares market. Particularly the major currencies. And my real angle is FX that is in association with the USD.

    For instance, GBPUSD, EURUSD, NZDUSD and AUDUSD. Gold and silver, priced against USD, and WTI (light crude oil) as they are all on the COT watch-list.

    This is because, with this selection, I can take advantage of the information from the COT report, providing the ‘C’ of my C.U.P. abbreviation (see ‘how I trade’).

    Is the COT that important? Anything that helps us trade with an advantage is important to my mind; there are enough variables in the market not to take notice of any obvious areas of influence.

    Silver gave a buy signal (retracement to the 21 day moving average) that we caught this week. Don’t chase this however, this signal has gone for the time being – possibly.

    Snip20150819_20

    This buy was supported by the COT, but be careful of the trend:

    Snip20150819_21You may have noted that JPY was not included in my primary watch-list. However, we do trade JPY against other major currencies, but without the support of the COT. We are currently in USDJPY and AUDJPY:

    Snip20150819_22


    Snip20150819_23

    In both these trades we bought with the ‘C’ being the big trend only, and not the COT.

    The COT, I find, does not play well with JPY.

  • Trading on news events – good luck on that one.

    We have touched on this term that we have called ‘conditional’ and its importance as a starting point to give us the best chance of making profitable trades.

    Conditional, it can be argued, is what moves markets. It is the foundation upon which we determine which way the trade will go. It beats guessing.

    We all know by now that I favour the COT (commitment of traders) report for my conditional; for information to help the probability of a trade being successful. However, a simple long term or weekly trend is also a good conditional. The conditional is something that gives us an advantage.

    For many (the crowd) the conditional is news events and/or the trading suggestions found in popular trading or investing publications. Good luck on that one. Most trade decisions made by small speculators, the crowd, everyday people like you and me, get it wrong. A contrarian trader, someone who takes the opposite trade to the crowd – if that were the only conditional method available – would be significantly more successful than the crowd.

    The ‘get it wrong’ bit is no better for large speculators. The hedge and fund managers. Indeed, their record is little better than the crowd. The commercials, however, are correct most of the time. Commercials, depending on which categories we are talking about, are the producers or end users of the commodity or futures market. The big money.

    Speaking metaphorically, commercials tell us which way the trade winds might blow. They don’t tell us how hard it will blow. And we are not sure from the commercials whether it will blow next week or next month. But the commercials do tell us that the blow will happen sometime and in what direction it will favour.

    Good enough. All we have to do is be patient and match the commercials, our conditional, with the specific recent trend and buy or short using our chosen price system.

    Snip20150804_10

    Here is the past 3-year Gold net position of the Commercials. The October 2012 short position was clearly shown. Notice where we are now, the green arrow. However, its early to buy gold as the recent trend needs to establish. But you probably get the general idea behind it all. The importance of conditional before anything else. Its something that gives us that needed advantage when we trade.


  • Slow Trader Diary – week 31

    Here are our cashed-in trades for week 31: Healthcare Partners Inc + £89, GBP/USD + £687

    IG is our broker, costs for the week were – £25.17

    Lets take a look at GBP/USD.

    Conditional: this is a graphed COT (commitment of traders) report giving us a buy condition.

    Snip20150801_2

    This graph represents several months so gives us the condition only, important as that is. From left to right, the first arrow is against the trend. Therefore we would not take that as a positive buy opportunity. However, the second arrow, and second buy indication, is good as it is with the recent trend. The buy condition should remain if the blue line on the chart continues to descend to a new low.

    The COT report is completed for the previous week on the following Tuesday and is published on Friday. It is therefore about two weeks old by the time we get it. However, it is like the oil tanker analogy where you move the rudder but it takes several miles to turn. Often that is the case with the COT. Even though it is old information it gives us a solid hint at the conditional.

    Once we have the conditional we need a matching recent trend. I’ll talk more on the (elusive) trend in follow up blogs.

    After trend we concentrate on price – in other words a buy signal. Here is our buy signal for GBP/USD this week. The first graph is in daily bars and the second is the same trade from bottom to top but in 4-hour bars. The second chart gives us a different view as to the dynamic of the trade.

    Snip20150801_3Snip20150801_4

    Moving on. You may have noticed the S&P. Here it is today:

    Snip20150801_7

    Knowing what the S&P is doing is not a trading conditional for individual stocks (or shares in the case of the FTSE). That would be too broad a statement. Interestingly, the movement however of the S&P was more or less mirrored by the stocks on my short list. Even being confident of the future movement of my selected stocks I still missed most of them. ‘How is this possible, B’? I hear you say.

    This is an example of what happened.

    Snip20150801_8

    This is Boeing, We notice by the date that the bottom (blue arrow) coincides with the predicted bottom of the S&P. This pin, at a 50% retrace, is a great buy signal. (Again, we will cover price in more detail in future blogs for those that are interested).

    If we choose to: buy on market, that is buy now at current price – or buy on stop, that is buy at a higher future price – or buy on limit, that is wait and buy at a lower price – is a judgment call. And one, on this occasion, I got wrong. You will notice that the bounce was so hard that after the pin the next days opening price gapped up. Only a buy on market would have worked. I went for buy on limit and missed it. “C’est la vie.”

    This was the same this week for four trades that I set.

    For the coming week we are keeping a sharp eye on gold. The commercials (that is the COT report) are warming up nicely to a buy signal. Beware of the trend however and remember, as well as recent trend, we also need price or more accurately price action. But more on this later.