Most of my trading time is currently in the Foreign Exchange (FX) market, so here’s a potted version of what it’s all about:
The FX market is a decentralised global market for the trading of currencies. It is by far the largest market in the world with an average turnover of some USD$4 trillion per day.
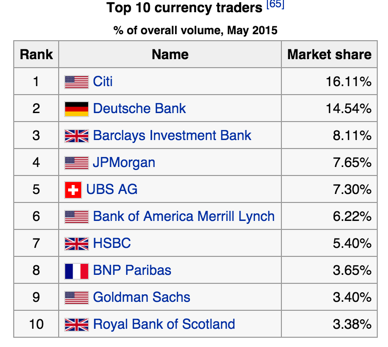
The main participants are the larger international banks.
And, the largest Financial Centres for these institutions are London and New York.
The FX market also comprises smaller banks, hedge funds, high frequency trading firms and the smaller trading firms/individual traders. Market share of all the smaller traders together is not more than 5% – but growing.
Trading is around the clock. Thank goodness the market is closed at weekends.
Most FX trading is speculative, that is the person or institution that bought the currency has no plan to take actual delivery of the currency; rather they were just speculating on the movement of that particular currency.
The large majority of currency turnover (roughly three-quarters) involves the United States Dollar (USD), next (but a third of the size) is the Euro (EUR), then the Japanese Yen, Pound Sterling, and further down is the Australian Dollar, the Swiss Dollar and the Canadian Dollar. The remaining currencies have a very small representation when compared to the USD.
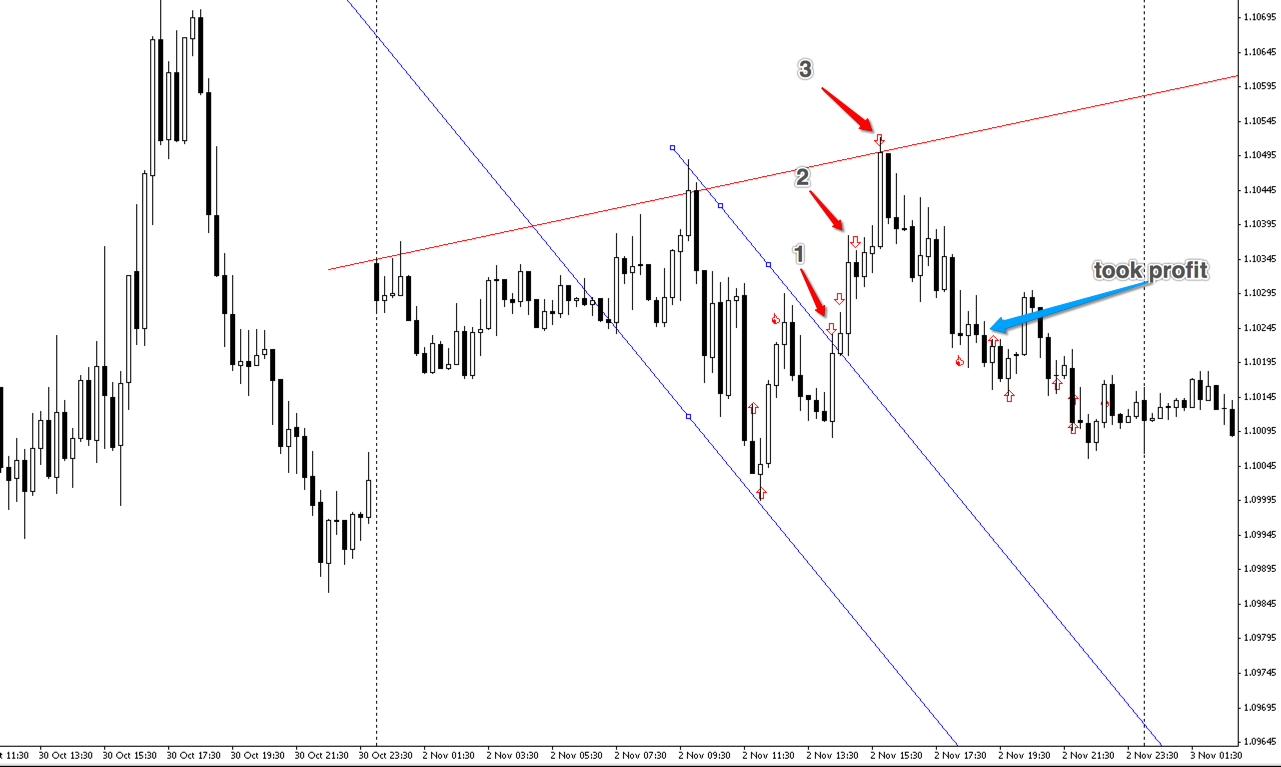
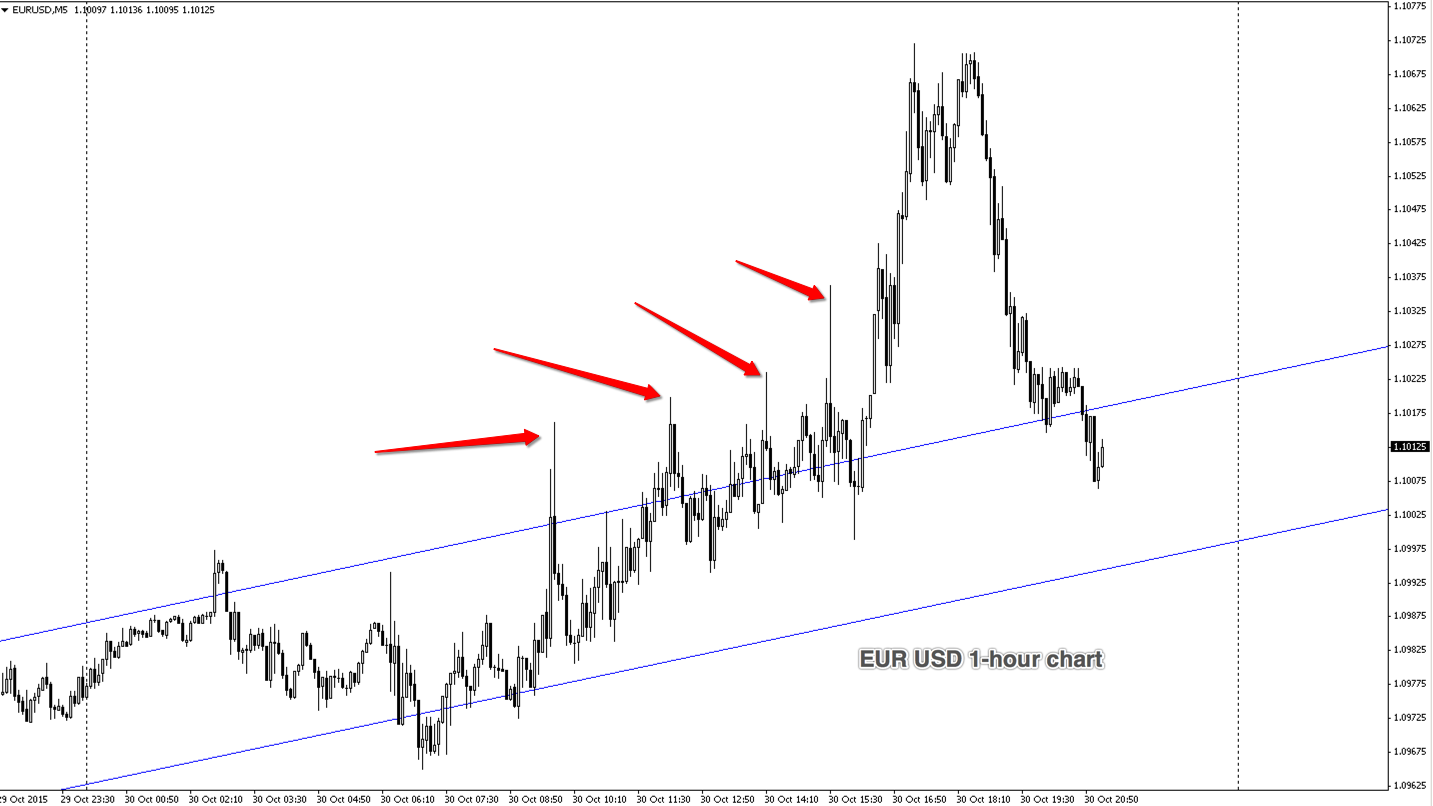
As I currently trade the 5-minute charts, I prefer to trade just one currency pairing: and for me its the EUR USD.