Tag: copper

  • gold and silver – are prices ready to drop?

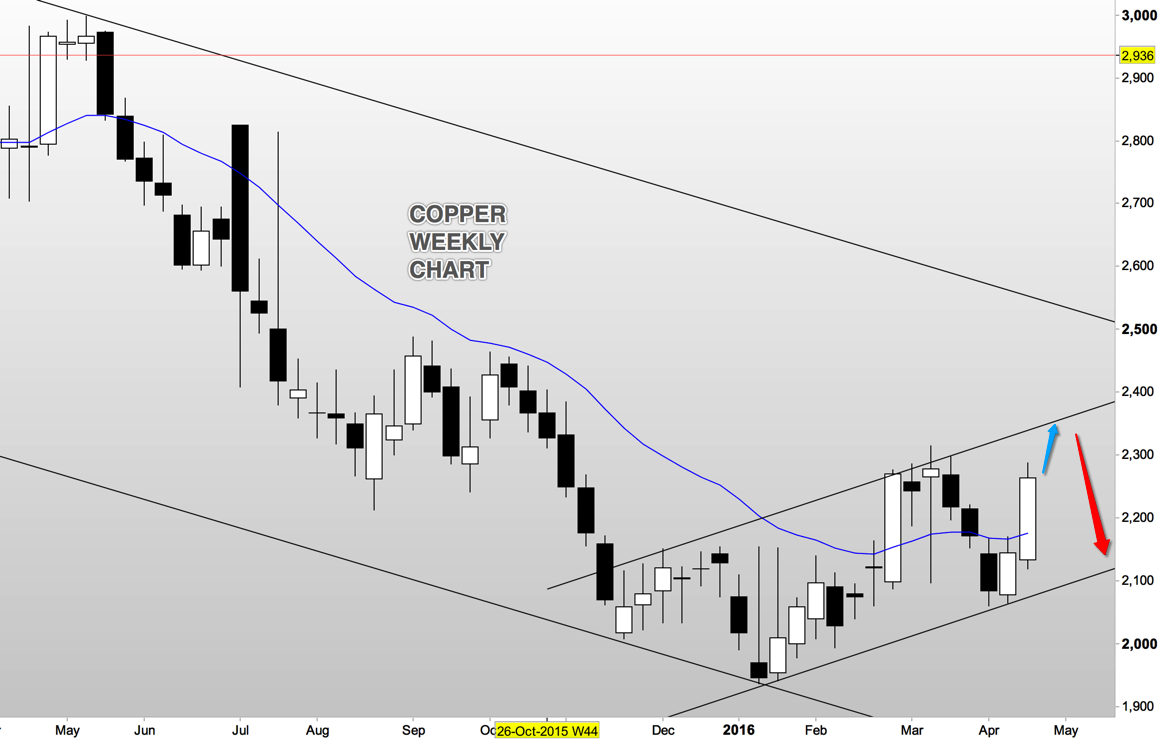
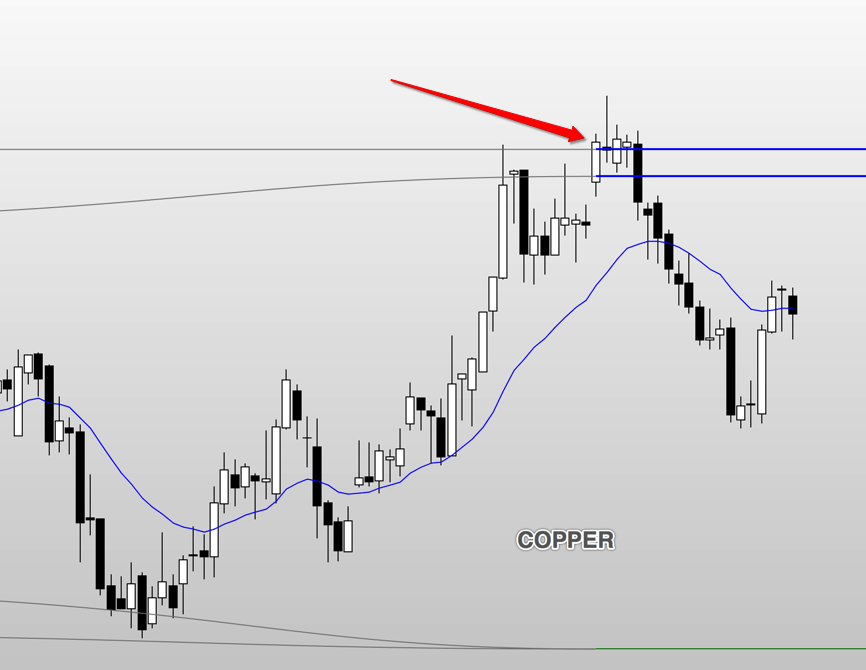
    Copper – An uneventful week for the commodities. All except copper which moved down without us and with gusto. Copper, however, had an unclear read on the COT (often the case with copper) and an unclear read on the daily charts. Therefore we are correct to be out – as to stay in would have been to rely too heavily on hope.

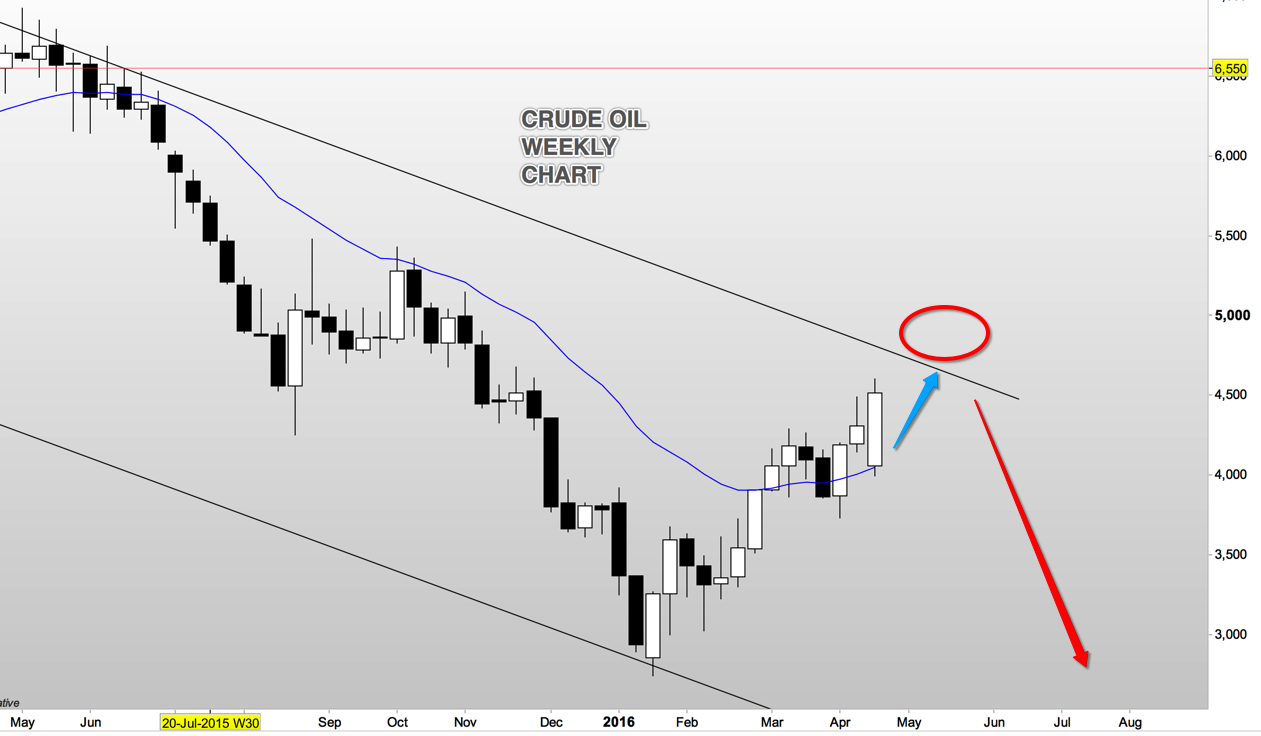
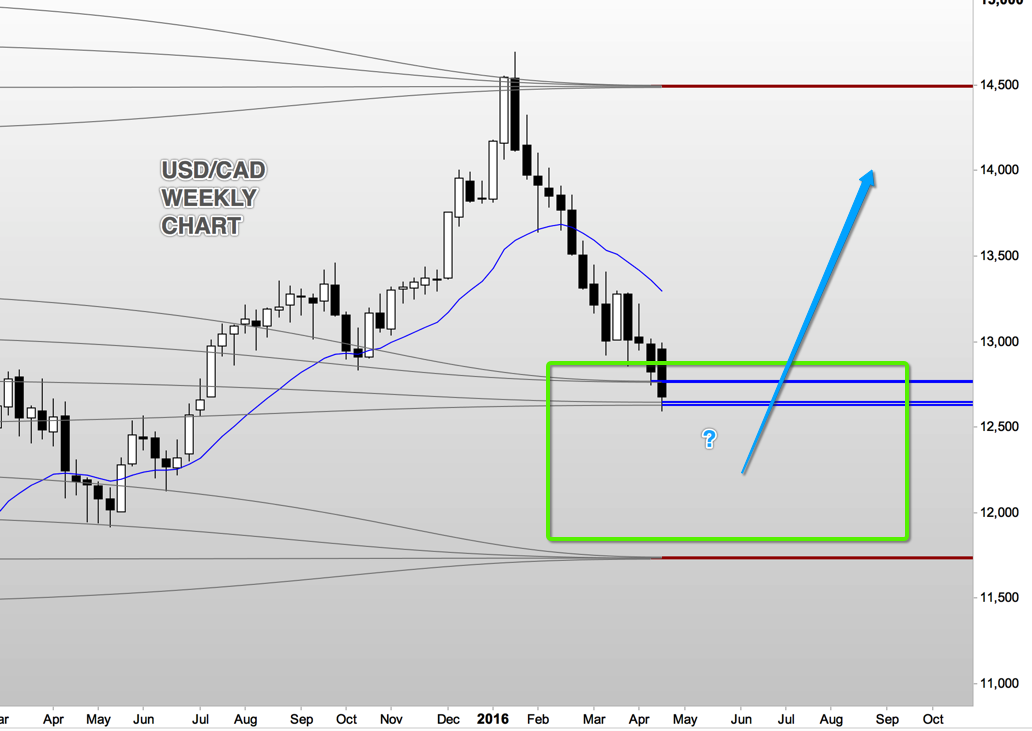
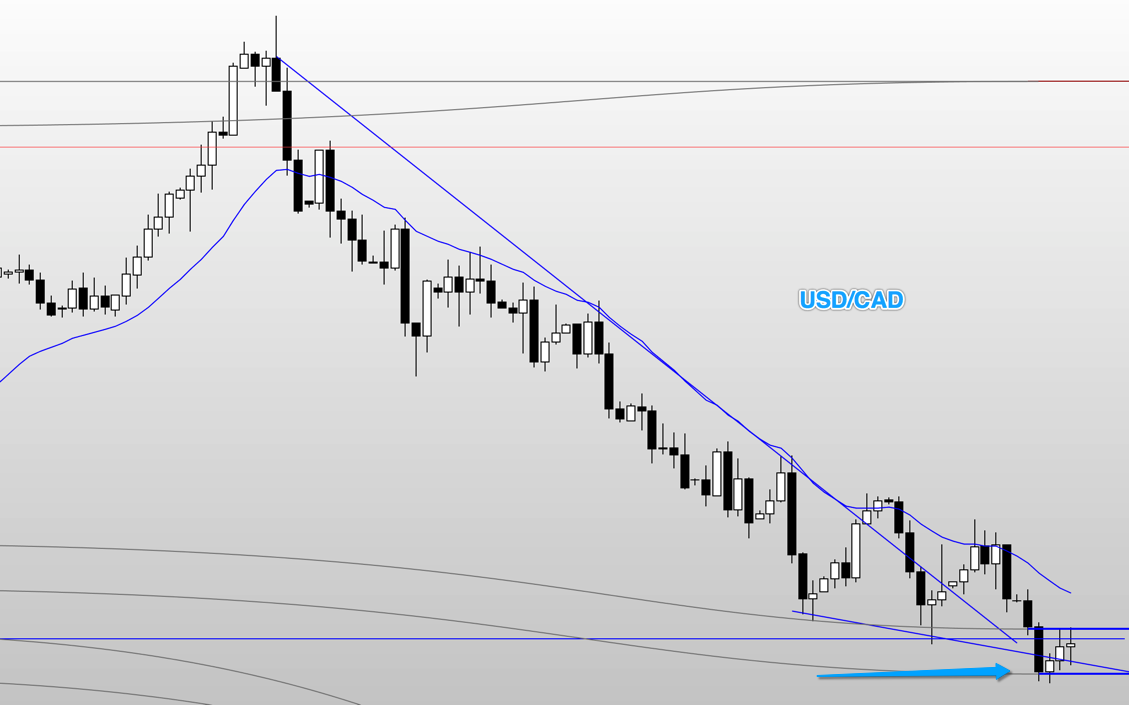
    Crude oil and USD CAD – We hold a small position on crude oil short. But a 200 pip climb is likely and at which point we may add to our shorts. USD CAD, which often reflects a delayed but exact opposite price movement to crude oil, shows a clearer picture. Too much reliance on the difference between these two charts (crude oil and USD CAD) is, however, a ‘chicken and the egg’ question and should be considered but not relied upon.

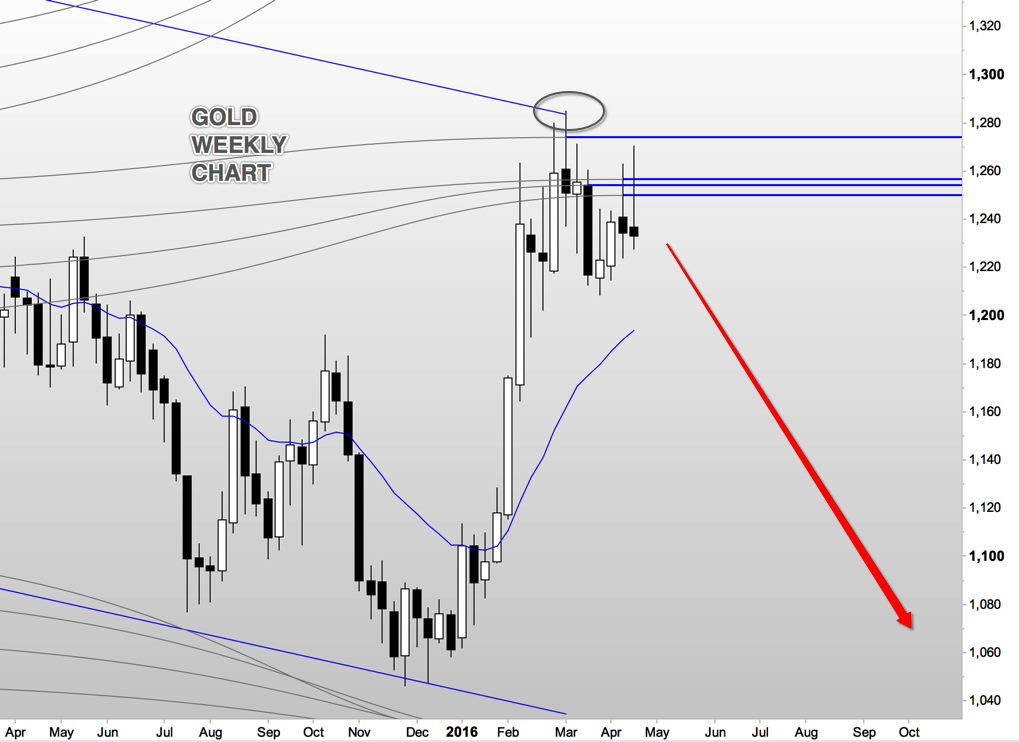
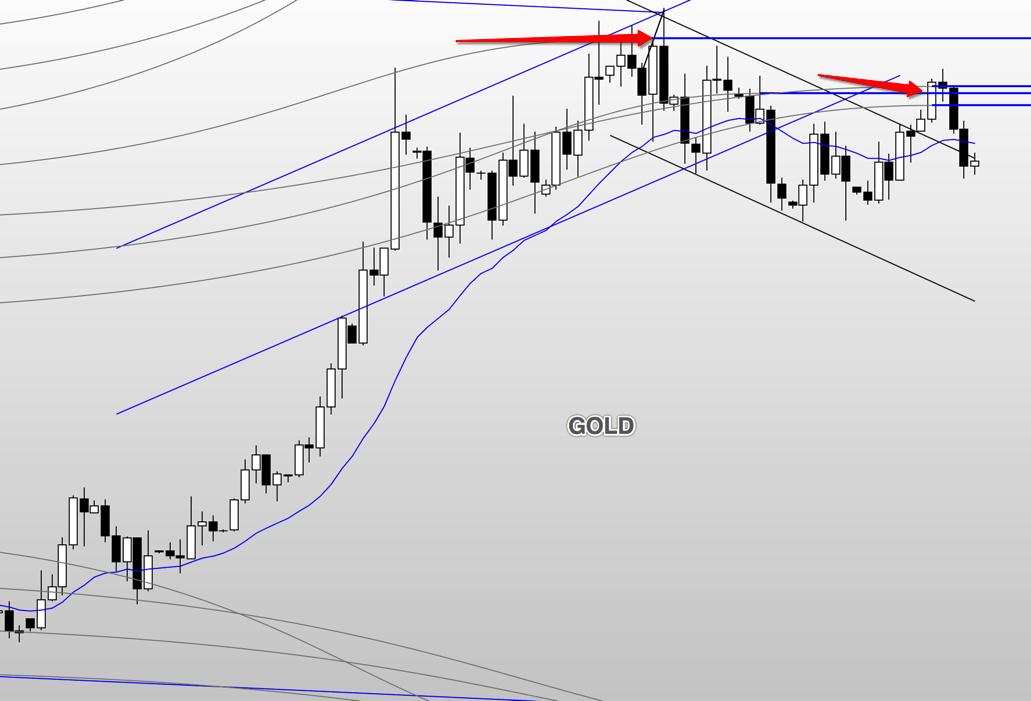
    Gold – Having taken some profits (short) from gold last week we continue to hold a small position short. Expecting to add to shorts anytime this week. Net position of the commercials remains at a 5-year low. This will provide great momentum to a drop in the price of gold if gold price per ounce falls to the $1,200 region.

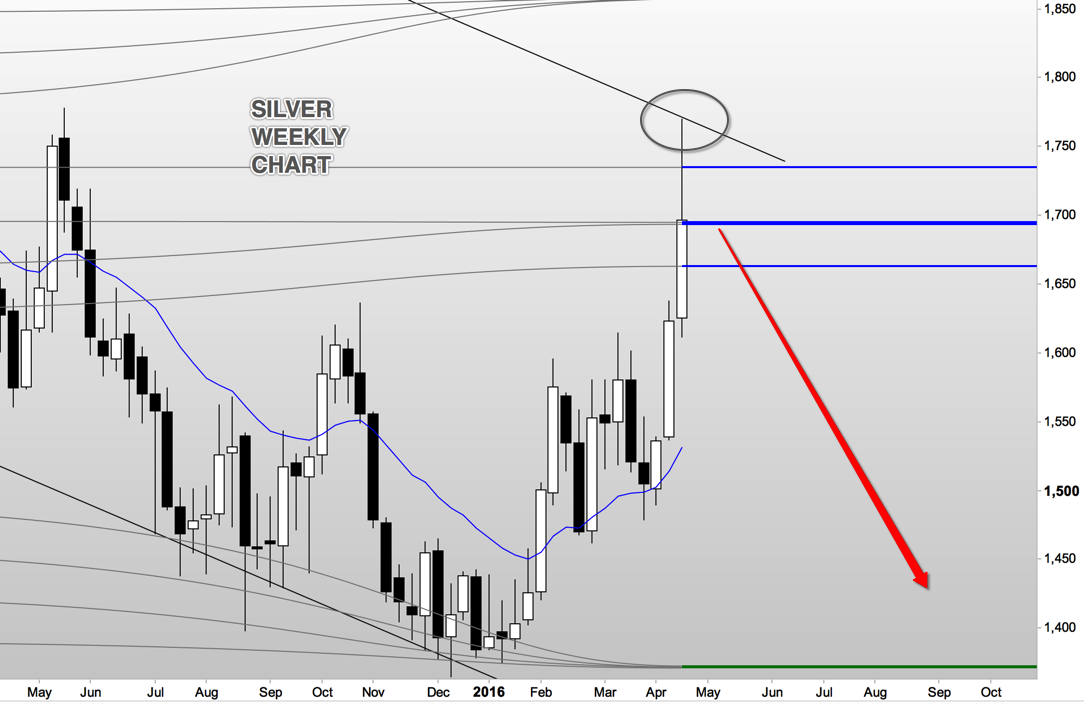
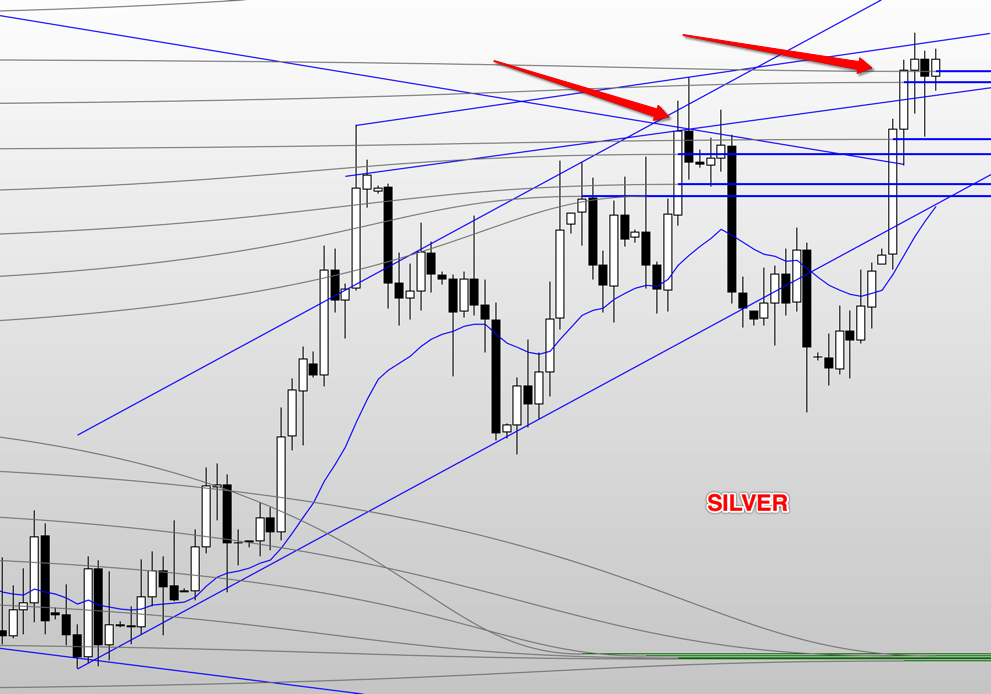
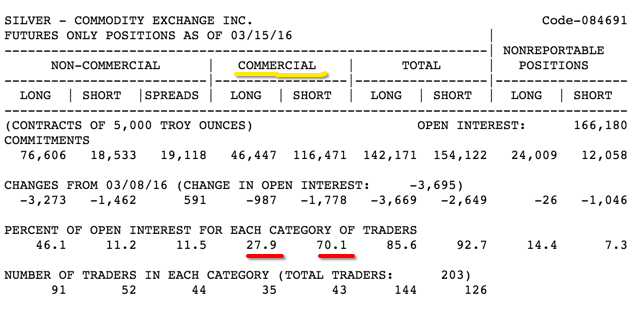
    Silver – Similarly with silver. We took some profit last week and continue to hold a small position short. Looking for a price climb to $1,730 before adding to shorts. Silver, however, has an even more dramatic picture on the COT as the net position of commercials is at a 10-year low. As with gold, any significant reduction in the price of silver will probably result in an exaggerated acceleration short.

    Intraday strategy – As an aside, much work has been done this week developing our short-term momentum strategy (namely using GBP USD intraday charts) on trading range breakouts and subsequent channels. I know this doesn’t make a lot of sense to the investor, but to a trader it is a high probability strategy with measurable risk and reward. And possibly the most lucrative of intraday strategies.

  • Gold and Silver finish week on a high

    Silver finished the week on a strong move up. Silver is at, or slightly above, a three-year trend line. The COT shows the net position of commercials at a multiple year low; meaning the majority of commercials (the big buyers and sellers) have short positions on silver. As do we. Difficult to hold through, but that is the strategy.

    Gold provides, as it so often does, a similar picture to Silver.

    Crude oil ventures up towards the position suggested on my charts last week. A possible short on crude may present itself this coming week.

    USD CAD had little movement in weekly chart terms.

    Copper dipped early in the week and gave us a reasonable out position. Copper reversed back up by the end of the week as anticipated.

    The strategy on commodities is to go long or short reasonably early based primarily on commitments of traders (COT) information and supported by analysis of weekly charts. We use weekly charts as that corresponds to the weekly COT release. The COT is released UK time late Friday evening and is based on the previous Tuesdays collation of information by the CFTC.

    This strategy often calls for a significant period of time, several weeks or even months, where the trade is out of the money. Treat the COT as turning a large tanker ship analogy – it ain’t quick!

    To balance this ‘slow’ strategy we’ve decided to include a portion of the Slow Trader fund in our intraday trading. That sounds fancy, but is just a way of saying we trade with charts that are incorporated within the day. In our case 1, 2, 15 and 60 minute charts.

    In this instance we take as many as 9 to 15 trades a day and normally complete all trades before the end of the day. I’ll discuss our strategies for intraday trading in next week’s blog.

  • Copper, Gold, Silver, Crude Oil and USD/CAD this week

    Copper has had a strong week and finished high. Silver in particular has spiked up. Gold also increased but finished the week more or less even. Crude oil has finished the week reasonably strong. USD/CAD is still some way from turning up and will need careful management.

    Here they are in slightly more detail:

    Snip20160423_2

    My premise on Copper has changed. Copper, I feel, is some way from a big turn down. I would consider a small increase in price before a drop to our low 2 weeks previously – and then a possible climb. We will look for the best price to exit our copper trade.

    Snip20160423_4

    Silver has had a dramatic couple of weeks. Two strong weekly moves up taking silver from the one year trend line to the, higher, 10-year trend line; indeed, the price of silver bounced exactly off this line – marked with a circle. Always difficult to short when everyone else is long. But that is exactly what we did. Of importance, and supporting our case, the COT for silver shows commercials at an 8-year record with the number of shorts compared to longs. Hold onto your hat!

    Snip20160423_5

    Gold has not been as dramatic as silver. Up in price all week, gold finished low for the week supporting our prediction of gold progressing further down in price over the coming weeks.

    Snip20160423_6

    I’m a supporter of a drop in price again in crude oil, but it may take its time. Price possibly getting to somewhere marked by the red circle. For now, we remain on the sidelines.

    Snip20160423_8

    USD/CAD price mirrors that of crude oil. Therefore, a trade on both is double the risk and a significant consideration. As with crude oil short, it is early days to consider USD/CAD long. A turn somewhere in the green box however is a good probability. But risk reward is excellent when we catch a trade early. Probability is the other major player in the traders equation; moreover, good management of early trades is essential.

  • Achieving excellent trade entries helps alot

    How our trades have progressed this week:

    Snip20160415_3

    We are short Gold. We shorted at the red arrows. That is, we expect the price to go down. If Gold goes down in price we gain. It is always difficult to find the best price and often it is simply ‘good is good enough’. But our first take here seemed excellent. Price this week had risen giving us a chance to add to our short. Again, this seems to be at a near top. We now have a lower high (the difference in height between the first and second arrow) and, therefore, the possibility of a continued drop in the price of gold, at least for a few weeks.

    Snip20160415_4

    We went long USD/CAD at the blue arrow. That is we want the price to increase. Our strategy starts with a major trend reversal, and that is often a difficult call. Probability of success is low at this stage, but reward, if it goes our way (up), is worth a trade. Our target is near the top of the screen shot.

    Snip20160415_5

    We first took Silver short at the left red arrow. Price went nicely our way – down. This week, however, has seen a good recovery in price. We entered again, short, at the second red arrow. This is a higher high – often not ideal for a short – but the three pushes up is good context for a trend reversal. From being nicely in the money, to out of the money, is part and parcel of our strategy. We hold until something tells us different, or until we get to, or near, our target. Our target is at the bottom of the screen shot.

    Snip20160415_6

    We shorted Copper at the red arrow position. That is we want the price to go down, and so far, Copper has obliged. We continue to hold until target. The recent retrace in price this week was not sufficient for us to add to our short trade.

  • Trading methods that suit

    A serious trader or investor has to use a method that they understand and that gives them an advantage, an edge – no matter how small.

    That method, or way of trading, has to suit the traders personality. The method could be fast-moving, lower time frame, or slow-moving, higher timeframe. Or a combination of both.

    Emotionally, the method has to suit too. For example, most traders are comfortable trading relatively large positions on slower moving, higher time frame trades such as daily, weekly or monthly charts; however, are less objective with such trades on lower time frame situations such as intraday (day-trading) opportunities.

    Once we sort our emotional tolerance we then need to consider our ability to manage such trades. Do we have the time and the skills necessary to trade lower time frame situations. This is where a trade entry and exit on say a ‘swing’ trade can play out in 10 chart bars or less – which on a 2-minute chart is 20 minutes. The same trade using a daily chart would take some 2 weeks.

    I use three clear trading methods with clear time frames. I feel that in each of the methods I have a small edge, and that is vital. The methods are:

    1. 30-year investing using detailed fundamental analysis of company figures. I’m primarily looking here at finding a company that is selling at half price or less and one that has been consistently excellent for many years (usually 10 years). The company, importantly, needs to be a company that will still be here, and profitable, in 30 years. The calculations took Nick and me over 9-months to develop.
    2. I trade gold, silver, copper, crude oil, treasury bonds and USD/CAD both long and short, and only trade on very specific signals. Each trade is held for several weeks. This is where I mainly trade the Slow Trader fund. The strategy here is sound, tested and profitable.
    3. Intraday trading of any stock, commodity, index or FX that suits – my favourite is GBP/USD. Skilfully, managerially and emotionally intraday trades are the most difficult. Intra day is also immensely time-consuming and takes many years to become consistently profitable.

    You will notice that each method avoids the market crash timeframe of 5 to 15 years. Where most investment and pension portfolios are positioned. Yes, the 30-year method will go through a few crashes during its investment period, but over 30 years the crashes simply provide a ‘dollar-cost-averaging’ opportunity to invest more. The only important crash in the 30-year method that is of concern is the last one. I appreciate that as its 30-years it may not be me making this decision!

  • Our medium term strategy holds good, for now

    Here is a snapshot of  our (open) results for the last week. I won’t normally show this detail as it can be misleading when we have a mix of recent and longer term open trades. But as all our trades have similar creation dates, I felt it was okay to include.

    Snip20160401_2

    We have a medium term strategy for these trades. Meaning from 6 to 12 weeks, we are 10 or so days in. Part of the strategy is to open the trade early. If an early trade is not close enough to the extreme (a top or bottom) then we will manage the trade to achieve better entries. Being early is difficult for many as it is nearly always contrary to popular opinion. Also, being early can provide excellent gains only to see those gains retrace to a loss – which is emotionally difficult and the reason why many traders cash-in too soon.

    By early trade, I should mention that we should also not be unreasonably early (it’s never that easy!). Patience is still key. For example, I think, a short in crude oil, currently, is too early. Crude has started to decrease in price this week from a recent up; but to take crude short now is premature. The picture is Similar for long-term treasury bonds that have a potential near term short opportunity.

  • Current short trades in Gold, Silver and Copper.

    We have open trades short with Gold, Silver and Copper.

    Our strategy here shows promise. The aggregate of these trades has seen us in the money by some £1,000. Soon followed by us being out of the money by about £900. The latter was a consequence of the last FOMC meeting and interest rate announcements.

    Higher prices, however, allowed us to add to our short trades more favourably and, later, as the price dropped again, to break-even on a our lower priced, original, trades.

    Our open trades (taken from eleven days ago) currently stand at over £3,000 in profit reasonably distributed between each of the commodities. Early days, however,  as we hold through (as long as our premise remains the same) to somewhere near our targets.

    The following is an update of our trade watch list for Slow Trader fund:

    No change in – Gold, Silver, Copper and Crude Oil.

    In preference to the S&P, I’ve included the 20+ Treasury Bond ETF.

    Moreover, in preference to the currency EUR/USD we will take GBP/USD.

  • Slow Trader Trades

    In our fund (Slow Trader) we recently invested short – that is to say, we want the price to go down – in Gold, Silver and Copper. (This strategy is a one to three-month trade, but varies slightly for each commodity). 

    Fund exposure is currently £70,738 (we are leveraged)

    Silver stop risk is £1,953 – between 4 trades.

    Silver target is £4,633 – between 4 trades.

    Gold stop risk is £1,252 – on one trade. (A limit order is in place to short more if gold price rises).

    Gold target £2,518 – on one trade.

    Copper stop risk is £1,929 – between 2 trades.

    Copper target £2,918 – between 2 trades.

    We use the Commitments of Traders (COT) report to give us a small edge. The COT is, other than cyclical analysis, probably the only indicator that is not price based. And, therefore, an independent view-point. We combine the COT with our own technical analysis of each commodity.

    Here is an example of the COT released last night. The same information is available for each of our commodities. My attention is on what Commercial is doing.

    Snip20160319_6

    The importance of getting the technical analysis right is due to the COT being in lag by nearly 2-weeks. Which, based on our strategy, is between a half and a quarter of the expected trade duration. In other words, we need to use a good amount of interpretation (and rely on technical analysis) for a significant chunk of the trade time.

    More specifically, COT figures are from each Tuesday but are not available until late evening (UK time) on the following Friday (i.e. 10 days). As the markets are closed till Sunday night (UK time) it puts the COT information nearly 2 weeks old. But even with that considered it’s still the best, broad, indicative information we have – other than our own technical analysis.

  • Slow Trader Fund Update

    Slow Trader is now closed to any new funds until next year. Here are the amounts:

    Snip20160305_1

    For the sake of simplicity, percentage gain or loss refers to original funded amounts.

    We are now ready for 2016. Our attention this year is on gold, silver, copper and crude oil. We will also trade from time-to-time the SPDR S&P 500 ETF fund (all sessions) and currency: namely the Euro against the US dollar. We may trade the occasional stock.

    We have an excellent short signal developing for silver. That is, we consider silver will drop again in price. Signals for each of our commodities happen no more than a couple of times a year. Therefore, when we get them we need to take full advantage.

    The S&P and EUR/USD are not cyclical like the commodities – therefore we will trade these via lower time frame charts (one or four-hour chart and, occasionally, as low as the 15 minute chart).

    Commodities are traded through daily charts and in conjunction with the COT report.

    For those building funds for grand kids, or simply looking to buy the Aston Martin DB11 – then here we go!