Tag: GBP/USD

  • Do we trade the news?

    Finding the right currency pair to trade is key to success. We want steady movement of price but not unpredictability or undue volatility.

    We also don’t want to move between currencies too often because, as a short-term trader, we get familiar with the flow (the news) of the currency.

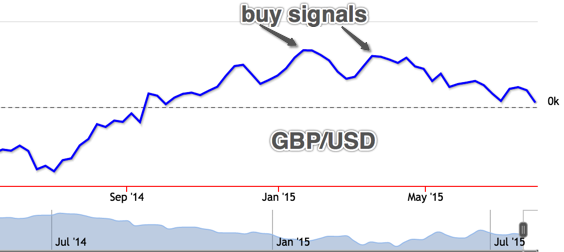
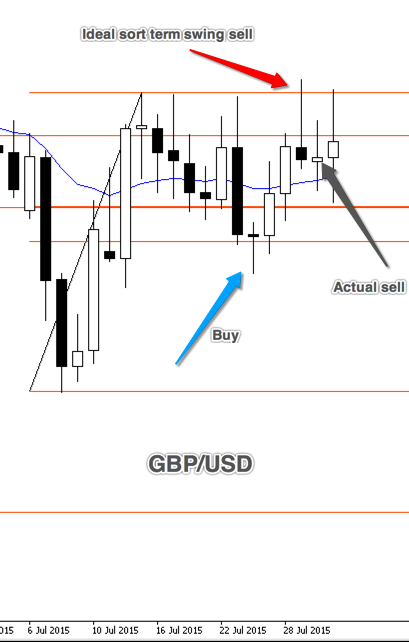
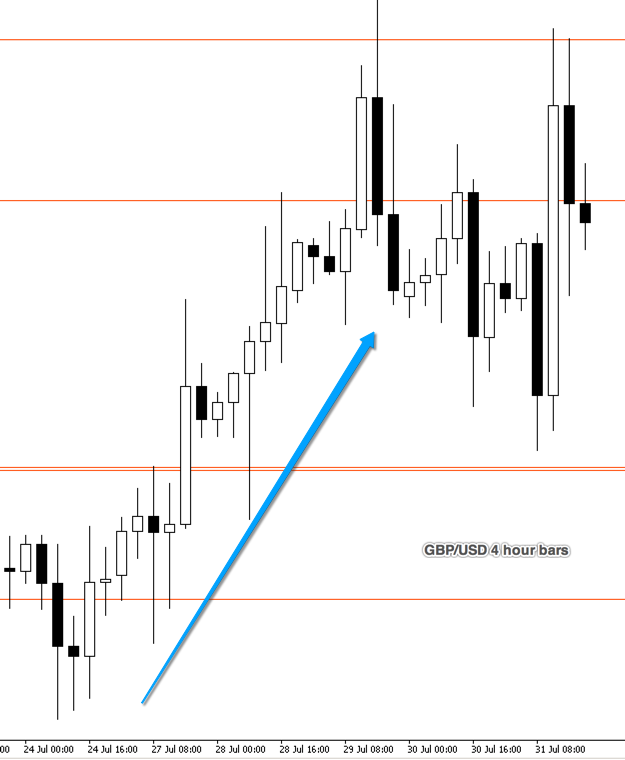
    We traded GBP/USD up until Brexit and then moved to USD/JPY. Since the recent North Korean influence we moved back to GBP.

    In what detail do we follow the news of a currency? here’s an overview:

    • Since November 2015 the pound (GBP) has depreciated by over 15% against other currencies, mainly because of worries caused by last year’s Brexit referendum.
    • As the cost of imports has risen, inflation has jumped.
    • At the last release, Consumer-price inflation (CPI) was 3%, the joint-highest level since 2012.
    • But inflation may soon be on its way down again.
    • The annual rate of CPI has averaged almost exactly 2%, in line with the bank’s target.
    • Of note, as an open economy with a fairly volatile currency, GBP is prone to short-term spikes in inflation.
    • The effect of the GBP plunge last year will, it is considered by reports, soon fade.
    • Import prices will therefore not continue to rise sharply.
    • There has been a close correlation between movements in sterling and the “core” rate of inflation (a measure which excludes the most volatile components). If that correlation continues, then within a few months, reports suggest, the headline rate of inflation should near 2%, assuming sterling holds steady.
    • But the pound suffers whenever there is bad news about Brexit, and there is a fair chance that the months ahead will contain plenty of that.
    • But for now, at least, inflation looks more likely to fall than to rise much further.

    News is the first consideration on our pre-trade list. For a news release that we consider could provide volatility or unpredictability we are trade ‘flat’ a few minutes before release of the news, and usually much earlier than that.

    We have an awareness of the news and importantly the possible volatility a certain news release can provide.

    But we do not:

    1. second guess the effect of a news release, or
    2. trade with a certain trade direction in mind due to news or fundamental considerations.
  • A chart mix

    My mother missed her step coming off a pavement and fell and broke her hip. She is doing remarkably well and I look forward next week to getting back to my trading, I’m a couple of weeks behind.

    Trading GBP/JPY on the 5 minute charts works well for me. I like the size of this market and on many days GBP/JPY can be quite defined. Anyone familiar with EUR/USD or even GBP/USD will find GBP/JPY quite lively.

    Many that trade major pairings will not take the spread into consideration, a mistake I think, but not a big one. Particularly if they trade from 15 minute charts or higher. GBP/JPY however, on a lower time frame, teaches us the necessity to consider the spread. To do otherwise, and be consistently profitable, is more difficult – I think.

    To make the best of both possibilities I’m happy with my results of concurrently trading GBP/JPY on the 5 minutes chart (as the priority chart) with a watch on USD/CAD, Gold and EUR/USD – each of which are on the 15 minute chart. I tried many possibilities but these choices give me good opportunity, diversity, liquidity and a spread value that I prefer.

    For example, GBP/JPY does not work with GBP/USD as both react almost in unison. Moreover, oil is often a mirror image of USD/CAD: so to trade one would have too much influence on the other. I do find that Gold and EUR/USD often have similar movements and on such days I consider a swap to AUD/USD or (and I’m in the early stages of this) the US 500 SPTRD.

    Other FX pairings, and particularly exotics, are not considerations for me. Primarily due to spread but also we are dealing with randomness and probability, and we don’t need big uncertainty too. As already mentioned, I’ve looked carefully at the US 500 SPTRD and this is a possibility on the 15 minute chart with good liquidity once the US market has opened.

    To trade the fund on the 4-hour charts is not possible (for me anyway) with already four intraday charts to manage. If my results are what I know they can be (and so far so good) over the next few weeks I will consider how to join the slow trader fund within this – more intensive – methodology.

  • The short the medium and the long

    What is new for 2017?

    Firstly, for my day trading from 5-minute charts I’ve chosen:

    EUR/USD  AUD/USD  GBP/JPY  GBP/USD and Gold

    I trade these most days (half day Friday) from 8am to 6pm. With an hour or two off here and there for good behaviour. I will report day trading ideas from time to time through this weekly blog.

    Secondly, for the ‘slow Trader fund’ from daily charts I’ve chosen:

    The UK top 200 shares

    This was after reflection over the holiday period. Trading currency pairings on a higher term chart, when probably taking the opposite view on a lower term chart, is difficult. Therefore, we needed a home for the fund and the UK top 200 shares fits the bill. Why not US stocks? There is a change in tax on US stocks and also we consider that later this year a large move in the dollar is likely. There is enough going on trying to pick share direction – we don’t need to have to factor in major currency changes too.

    I’m excited about this move of the fund. We will trade both long and short based on ‘price action’ technical analysis. It will provide stability and the increase that we’re looking for. I review all qualifying shares every trading day morning. Entries are based on daily charts, however, best entries may be found on lower time frame charts. Ideally we are looking for entries to last a few days out to a maximum of a few weeks.

    I’ve chosen a selection of the top 200 shares that have what I’m looking for in terms of price, liquidity and stability. I will blog the complete list later and keep members updated of results through this blog.

    Finally, we also want to provide information for the best UK pension ever. That is long-term (many years) investment via a UK share ISA.

    This is a reintroduction to Slow Trader of fundamental analysis. Nick has kindly agreed to provide regular information from his spreadsheet on which UK shares are great performers and available at the right price. Nick will be reviewing the FTSE 350 (that is the FTSE 100 and 250 combined) and I will keep you updated from this list. I won’t provide a description of companies, as I’ve done before, but simply the essentials from the spreadsheet. These are for long only consideration.

    This is all about the fundamentals and the incredible analysis tool that Nick has created. However, James and I will add our long-term (weekly and monthly chart) technical slant. More of this soon.


  • Trading is about dealing with contradictions

    Here’s the results of the trading week. Something I don’t normally show as it’s a distraction. It would be a distraction to try to make the figures each week. However, a good start and finish to the trading week.snip20161001_3It is not wise to trade if we have distractions. And some distractions are important, so I didn’t trade much mid-week.

    On a different note, something obvious to me this week is that trading is largely about dealing with contradictions. No wonder it’s not easy.

    Below: 1-hour chart, 15-minute chart and 5-minute chart. Each chart is of the GBP/USD pairing and for the same current time. You will notice the purplish line through the middle of each chart which is a ‘value’ line. (or linear regression). Price tries to get back to value. However, value depends on the criteria taken into consideration. The trader trading the 5-minute chart is looking for a different value to say – the trader trading a daily chart. They contradict.

    And it is a traders skill to determine which timeframe they wish to trade and which higher value line may have an influence over them for the timeframe they have chosen.

    snip20161001_7

    snip20161001_8

    snip20161001_9

  • Brexit, are we going to trade it?

    Before Brexit here’s gold and silver last week.

    You will recall that we are only looking for short positions in gold and silver. We took profits in both nearly 2-weeks ago and have been looking for an opportunity to take a short since then. Although both gold and silver crept down and tempted everyone to jump on board, this would have been hopefulness.

    Here’s silver: silver provided a short signal which I missed, and mentioned last week. That would have given us a profitable move down and exit at the blue arrow. However, without a clear ‘short’ context the danger was always the strong pullback, which happened yesterday, and that is why it was correct to not hold our original short too long. The pull back may just be to the moving average, shown by the blue line, or a move to equal the previous high at 1,800; or, significantly higher with a measured move of the previous leg. We will need more information before acting.

    Snip20160604_1

    Gold below shows the short that we exited on 19th May. I was somewhat quick as the second leg down would have doubled our profit. However, the move up yesterday (similar to silver) has brought the price back to our ‘buy back’ position on the 19th. As the climb yesterday has closed above the moving average I’d expect more upwards movement next week before providing a short opportunity.

    Snip20160604_2

    How will Brexit affect our trading? As an aside, one issue we have with trading gold and silver, particularly with a reasonable sized fund, is the size of the average bars (potential movement of price on average over a certain time period) in respect to spread. If you have bought shares in a SIPP before you will know that your broker charges you anything from £5 to £14 per trade. That is why you need to buy a certain amount of shares otherwise your broker’s fee represents too high a percentage against you. The same is true in reverse with spread betting.

    Silver, for example, has a spread of 3 pips. That is, for your buy/sell you will pay 3 pips at whatever price per pip you trade. If you trade £1 per pip, then, from the broker’s perspective, you are charged £3. (Not actually £3, you will notice that your entry line on your chart is 1.5 pips to the negative as will be your eventual exit line – with both together equalling 3 pips). That’s fine at £1 per pip, and actually a good deal. However, you ain’t going to retire soon on £1 per pip in silver. Our fund trades more in the region of £10 to £20 per pip; and that represents a high broker’s fee if the trade goes against us.

    Far more representative of average bar size – when compared to spread, and also compared to the amount we wish to trade – is the currency pairings GBP USD and GBP JPY. The spread on these are about 2 pips and 3 pips respectively (I say ‘about’ because they do fluctuate, particularly in times of high volatility). However, typical corresponding bar sizes of the above currency pairings (GBP JPY being the biggest) are 10 to 20 times bigger than say gold or silver. And that is why we need to move most of our fund trades to the currency pairings.

    That brings me to the initial question, how will Brexit affect our trading? Clearly we all know that it will be a time of high volatility in GBP and anything in association with GBP. To that end, the spread will increase significantly. This will need to be carefully monitored. But spread increase is okay if average bar size increases in unison. Brexit could provide a lot of barbed wire (bars that bounce up and down but close fairly tight and don’t actually go anywhere) or, of course, it could set-up a great trend. My own thought is that it is going to be a bit of both and we need to read the movement well to take advantage. So are we going to trade during Brexit? probably not on the 23rd June, but for the run up – most certainly we are.

  • Current short trades in Gold, Silver and Copper.

    We have open trades short with Gold, Silver and Copper.

    Our strategy here shows promise. The aggregate of these trades has seen us in the money by some £1,000. Soon followed by us being out of the money by about £900. The latter was a consequence of the last FOMC meeting and interest rate announcements.

    Higher prices, however, allowed us to add to our short trades more favourably and, later, as the price dropped again, to break-even on a our lower priced, original, trades.

    Our open trades (taken from eleven days ago) currently stand at over £3,000 in profit reasonably distributed between each of the commodities. Early days, however,  as we hold through (as long as our premise remains the same) to somewhere near our targets.

    The following is an update of our trade watch list for Slow Trader fund:

    No change in – Gold, Silver, Copper and Crude Oil.

    In preference to the S&P, I’ve included the 20+ Treasury Bond ETF.

    Moreover, in preference to the currency EUR/USD we will take GBP/USD.

  • Slow Trader Diary – week 35

    We are open with gold.

    Broker charges for the week were a credit of £9.48.

    Here’s our gold trade:

    Snip20150829_1

    Our target is in the region of 1212. This is in-line with the COT and if the present Up continues it will nicely form a recent Up (or recent trend upwards). However, as we have seen this week, the market remains volatile.

    Of the other trades we considered earlier in the week:

    Silver moved down lower than expected, did not provide price at a level I could determine. So no trade.

    Snip20150829_3

    NZDUSD remains a possibility to go up briefly. But it is presently stable below its low of recent weeks. It may move up soon. However, this is an advanced trade as it is against the big trend and is without a recent Up.

    Snip20150829_2

    GBPUSD, having been quite stable through the initial turmoil of the week, just blew down. It may turn at the 15350 region or continue down to as low as 15190. I’m less convinced of this trade. It has, for now, become choppy which always makes for a difficult read. The COT is still a buy but is weakening, we do not have a recent trend, although the mid trend remains up. Only excellent (daily) price will convince me to take GBPUSD at the moment.

    Snip20150829_5


    EURUSD is approaching our predicted bounce point. However, the COT is about to turn and we are all aware of the volatility presently associated with the EUR. My own thought is that the bounce could happen but it will be short lived. Price may turn down again before the previous high thus establishing a recent Down (or recent down trend).

    Snip20150829_6

    WTI, or crude oil, bounced off its lower stop this week. This move is gently supported by the COT, nothing dramatic for the time being. Too early to decide, but it is on the watch radar now.

    Finally, the S&P and FTSE have moved up slightly, but the roller coaster might not be over yet.

    As I’m away for a few weeks the next diary will be 26th September.

  • Wonderful opportunities

    Difficult times in the trading business for the longer-term investor.

    Wonderful opportunities for short-term swing traders, if we get it right.

    I sat on the side lines as the markets slipped recently. Unable to take advantage of shorts (trading the market to go down) as it all happened so suddenly. The large dips in FX (foreign exchange pairings) occurred, in those I monitor, within a minute.

    There are after shocks, so timing any recovery is interesting. Those that I will consider are:

    Snip20150826_35

    Silver. At some point soon I consider Silver will rally, short term. However, recent Up (or recent trend) is against us so a buy to go up becomes an advanced move, meaning the buy signal needs to be clear.

    Snip20150826_36

    NZDUSD is firmly down on the long trend. The COT is a buy, but we have to be careful with the COT signals when the COT is going against the longer trend; the COT, in this instance, still often works but can be short lived. Having said that, there is a (possible) short term buy opportunity here.

    Snip20150826_37

    I’m looking for a buy in gold at about 1125 price with a good buy signal. Catching the signal with the correct buy: on-market, on-limit or on-stop is key.

    Snip20150826_40

    GBPUSD has been relatively stable over the last few days. A retrace to the 21-day moving average (MA) is worthy of consideration. It may happen quickly, if at all.

    Snip20150826_41

    EUR might strengthen again soon against the USD. Unless I get (daily, or, at a pinch, 4-hour) price action at a support level I will not take this until about the 1120 level.

    Snip20150826_44

    Finally, the S&P 500. This, I find, is possibly the most difficult to judge. With the recent dip the S&P could provide a good gain on a bounce. A buy in the region of 1836, but could go down further to the 1770 region. Good price action, or whatever is your chosen price criteria, is important here.

    Lower trade values and generous stop positions are considerations when volatility is high.

  • JPY does not play well with the COT

    Some good opportunities in the foreign exchange pairings (FX) this week.

    I am more and more concentrating on the FX market rather than the stocks and shares market. Particularly the major currencies. And my real angle is FX that is in association with the USD.

    For instance, GBPUSD, EURUSD, NZDUSD and AUDUSD. Gold and silver, priced against USD, and WTI (light crude oil) as they are all on the COT watch-list.

    This is because, with this selection, I can take advantage of the information from the COT report, providing the ‘C’ of my C.U.P. abbreviation (see ‘how I trade’).

    Is the COT that important? Anything that helps us trade with an advantage is important to my mind; there are enough variables in the market not to take notice of any obvious areas of influence.

    Silver gave a buy signal (retracement to the 21 day moving average) that we caught this week. Don’t chase this however, this signal has gone for the time being – possibly.

    Snip20150819_20

    This buy was supported by the COT, but be careful of the trend:

    Snip20150819_21You may have noted that JPY was not included in my primary watch-list. However, we do trade JPY against other major currencies, but without the support of the COT. We are currently in USDJPY and AUDJPY:

    Snip20150819_22


    Snip20150819_23

    In both these trades we bought with the ‘C’ being the big trend only, and not the COT.

    The COT, I find, does not play well with JPY.

  • Slow Trader Diary – week 32

    No trades cashed-in this week.

    We also had no costs against us.

    This week we entered Pace PLC and DTE Energy Co, both on a December quarterly trade.

    We are mostly short term swing traders: so are our trades taken as DFB (Daily Fund Bets) or quarterly futures trades?

    The DFB gives us a tight spread (the difference between the buy and the sell price) but has a daily interest cost. A quarterly futures bet (near, mid or far quarter) has a larger spread the more distant the quarter but carries no interest charge. So which one to take – a DFB or a future quarterly – depends on time. In other words, it depends on the duration we think we will hold the trade.

    Currency pairs (FX) can only be traded through a DFB. With shares and stocks, however, we have the option of a DFB, or a quarterly futures trade; I will look to take a mid quarterly trade where possible.

    Here is our trade with DTE Energy Co:

    Snip20150808_13


    DTE Energy is conventional electricity. Our conditional is simply a consistent ten years of positive earnings per share (EPS) percentage growth. As for recent trend, the stock is trending up which we can see from higher highs and higher lows. The 21 day moving average supports this. Our price, for us in this example, as there are many personal ways of determining price, is the confluence of a support line (a 61.8% fibonacci retracement line to be exact) and the pin bar the day before. We took the trade on limit, which meant the price did come down to a more favourable price before we bought automatically. We have set a target limit at 90.67. That gives us a risk reward of nearly 4 times.

    Here is our trade with Pace PLC:

    Snip20150808_14

    Pace PLC is telecommunications equipment. This trade has gone against us slightly and I’m not happy with my decision to take this trade. Our conditional, again, is ten years of positive EPS percentage growth. However, it is the trend that is our weak link. Over the last 18 months, except for a large gap up, the trend is down. This is made more so with the drop in price yesterday. A closer look at the recent trend confirms this. Our price, a confluence of support level and price action is fine but is secondary to the trend. Also, our price action, being the pin, in hindsight, is black where a white pin would have been preferable. I will tighten our stop to minimise any loss and if we get a rebound I will sell early at, or close to, break-even price.

    No buy or short signals in FX this week. FX requires a regular watch so as not to miss the opportunities. By regular I mean a once daily detailed review of daily bars. This can be done, because of the timing of the FX New York close daily bars, at 9pm or 10pm, depending on UK/US time difference; or, as is my preference, early, before 7am, UK time. Then a look every 4 hours where possible, to match the 4-hour bar close times. However, I find that as we get close to a buy or short opportunity the best way is to set an automatic (ambitious) entry.

    Particularly looking this coming week for a buy opportunity in GBP/USD.

  • Slow Trader Diary – week 31

    Here are our cashed-in trades for week 31: Healthcare Partners Inc + £89, GBP/USD + £687

    IG is our broker, costs for the week were – £25.17

    Lets take a look at GBP/USD.

    Conditional: this is a graphed COT (commitment of traders) report giving us a buy condition.

    Snip20150801_2

    This graph represents several months so gives us the condition only, important as that is. From left to right, the first arrow is against the trend. Therefore we would not take that as a positive buy opportunity. However, the second arrow, and second buy indication, is good as it is with the recent trend. The buy condition should remain if the blue line on the chart continues to descend to a new low.

    The COT report is completed for the previous week on the following Tuesday and is published on Friday. It is therefore about two weeks old by the time we get it. However, it is like the oil tanker analogy where you move the rudder but it takes several miles to turn. Often that is the case with the COT. Even though it is old information it gives us a solid hint at the conditional.

    Once we have the conditional we need a matching recent trend. I’ll talk more on the (elusive) trend in follow up blogs.

    After trend we concentrate on price – in other words a buy signal. Here is our buy signal for GBP/USD this week. The first graph is in daily bars and the second is the same trade from bottom to top but in 4-hour bars. The second chart gives us a different view as to the dynamic of the trade.

    Snip20150801_3Snip20150801_4

    Moving on. You may have noticed the S&P. Here it is today:

    Snip20150801_7

    Knowing what the S&P is doing is not a trading conditional for individual stocks (or shares in the case of the FTSE). That would be too broad a statement. Interestingly, the movement however of the S&P was more or less mirrored by the stocks on my short list. Even being confident of the future movement of my selected stocks I still missed most of them. ‘How is this possible, B’? I hear you say.

    This is an example of what happened.

    Snip20150801_8

    This is Boeing, We notice by the date that the bottom (blue arrow) coincides with the predicted bottom of the S&P. This pin, at a 50% retrace, is a great buy signal. (Again, we will cover price in more detail in future blogs for those that are interested).

    If we choose to: buy on market, that is buy now at current price – or buy on stop, that is buy at a higher future price – or buy on limit, that is wait and buy at a lower price – is a judgment call. And one, on this occasion, I got wrong. You will notice that the bounce was so hard that after the pin the next days opening price gapped up. Only a buy on market would have worked. I went for buy on limit and missed it. “C’est la vie.”

    This was the same this week for four trades that I set.

    For the coming week we are keeping a sharp eye on gold. The commercials (that is the COT report) are warming up nicely to a buy signal. Beware of the trend however and remember, as well as recent trend, we also need price or more accurately price action. But more on this later.