Tag: FTSE 350

  • Do it (trade) like a casino

    I day trade the currency pairing GBP/JPY with 5-minute bars as the primary chart. My edge for these trades includes: the recognition of context, or where the chart is in regard to a trend or a trading range; my strict minimum trade requirements (as I’m a retail trader I have to pay and, therefore, consider the spread); and, finally, my Green Line Entry Measure (GLEM).

    Each of these points are contained within a strategy that I’ve proven through ‘live’ trading and rely upon to provide consistency over time for all of my trades; a strategy – because of the nature of the game – that is always open for amendment. A strategy that makes us more like a casino; the management of the casino rather than the gambler.

    A casino – after taking into consideration all the big winners, the big losers and everyone in between – will consistently take 4.5% in profit from all takings, over time. That is because they too (the casino) are working to a tried and tested strategy. My volume is, of course, nothing like a casino, so I need to take trades that are 60% probability or better. If less than 60%, on the rare occasion that I select low probability trades, I need to have a consistent reward/risk that makes the trade worthwhile.

    Moreover, I also trade the Slow Trader Fund in several currency pairings, the commodities of gold and oil and Nick’s top FTSE 350 companies. These are all traded with the 4-hour bars as the primary chart. I’ve chosen 4-hours as this provides multiple trading opportunities a week. Moreover, with my day trading my charts need to be linked to my broker as I require an accuracy here of 0.1 of a pip. These charts (British broker) do not provide the important New York close bars which would be required if I were to select entries from daily bars. Hence, another reason for 4-hour instead of daily bars.

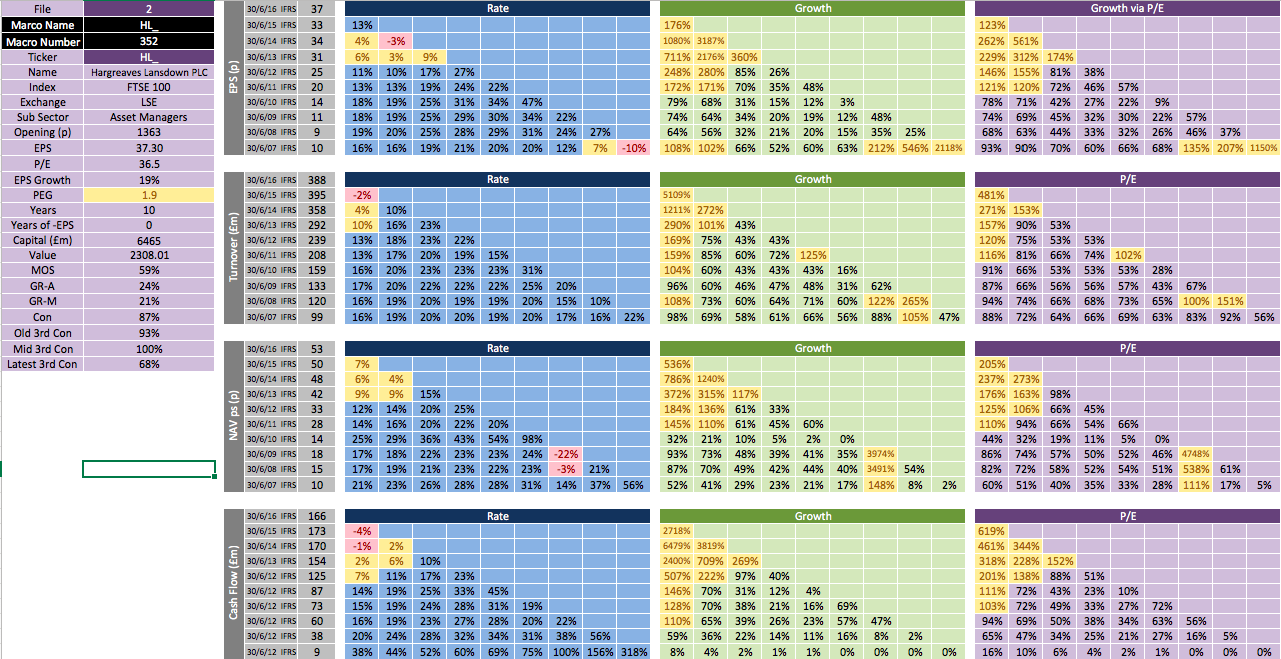
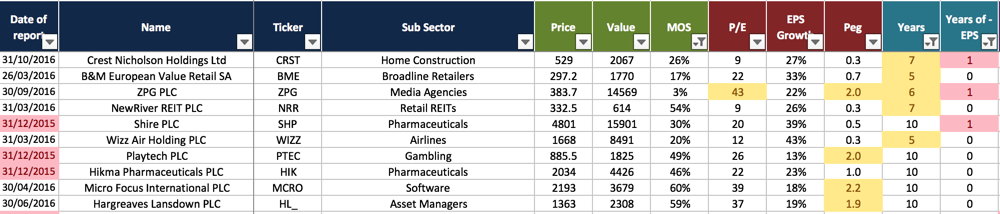
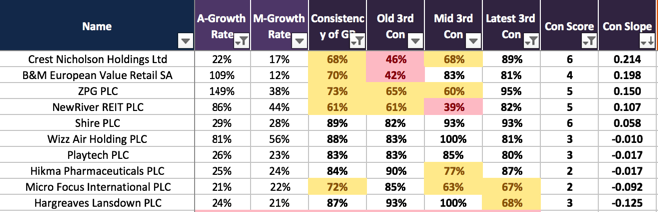
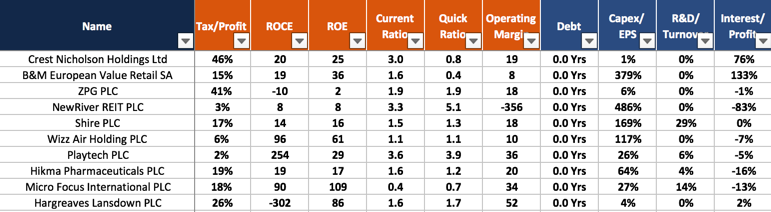
    With regard to Nick’s top FTSE 350 companies, please do not miss read me here, they are, for investors, a long-term consideration. They came to the fore because of their strong fundamentals and ‘value’. Because of their strength, fundamentally, these companies could ‘weather’ a market turn down (or two) better than many. I have placed them in the 4-hour trade cycle but: with my context, probability and price action strategy, it could almost be any ten companies.

    As an aside, the best index for technical judgment of the longer-term market cycle, I consider, is the weekly or even monthly bars of the S&P 500 index. Yes, even for companies within the FTSE 350. Movement on the S&P is generally followed by the FTSE. I’ll provide a S&P synopsis soon.

    To finish, we have detail on short-term trading (my day-trading and 4-hour chart work) and information on the very long-term investment considerations (Nick’s top ten). However, we do not have information on the mid-term investment/trading opportunities. This is not my area.

    Steve, however, has a great track record in this regard, and one that is just getting better and better. A key member in a ‘high energy’ company, Steve is responsible for a budget that annually goes into the multiple millions. Therefore, not a full-time analyst but someone who has put his working skills to good use in selecting mid-term investments. From many examples is his purchase of Sky PLC in early December, and before Sky made a 25% positive jump.

    I will ask Steve, if he’d make a contribution to this blog and share with us his mid-term ideas and thoughts. I hope he will agree.

  • More on the long-term investment model

    My recent blog(s) were in regard to long-term investing. By long-term I’m thinking 15 to 30 years. Nick has given us, from each companies past ten years of annual reports, where available, his estimation of a company’s future value (MOS) and measure of consistency as a percentage of growth.

    From the FTSE 350 companies, Nick found that only ten companies met his criteria. Of these top ten companies, meant for long-term ISA or SIPP investment, we need to understand the principles of the company and be satisfied that a company has a product, method or brand that will be around after the next ten years.

    Nick has provided us with an old 3rd, mid 3rd and latest 3rd consistency to help us determine this. For example, Blackberry would have scored highly all the way to its end on this system; however, the clue would have been in Blackberry’s old, mid and latest consistency which would have shown a big down slope.

    Nick will refresh these calculations every few months. Primarily to capture the most recent annual report – three of which, on our current calculation, were from the end of 2015. To help, or possibly confuse, I’ve provided a brief chart synopsis of each of the top ten companies. I will continue to do this at the release of an updated calculation from Nick.

    New readers to this blog please note that my full-time business is short-term trading. Most of my blogs therefore will be focused on the short-term stuff. My detailed ‘how I trade’ page is only associated with short-term trading.

    Personally, I’m only in favour of short-term and the very long-term trading/investing model. I’m not in favour of the mid-term trading timeframe which constitutes the majority of the trading/investing world – pension funds and the like. This is a timeframe from the near term out to 15 years. I also feel that many pay too much for the services of providing mid-term investing. ‘Tony Robbins, Money Master the Game’ shows how every 1% in charges results in providing the investing company 20% of the final fund. Possibly a reason why a finance company made our top ten!

    If we are to invest in the mid-term, Robbins advocates a cash, share, commodity and bond mix. There are a few investment companies that provide such a fund – an independent financial advisor could help. Such funds are not exciting when the share market is going up rapidly; but such a fund usually provides a profit  – even when the share market heads south.

  • Top ten companies that are selling at a discount – FTSE 350

    On the previous blog, also dated 25th February 2017, Nick has provided the list of companies from the FTSE 350 that made the grade for our long-term investment.

    The spreadsheet was the cumulation of focused effort by Nick and me over a 9-month period a few years back. Nick, spent, subsequently, a considerable amount of time improving the calculation.

    Here’s an example of the back sheet of information that is taken for up to 10 years of figures for each company in the FTSE 350 – and this does not show the mind numbing calculations that are used within each of these boxes.

    screenshot-2017-02-24-11-15-36

    We must emphasise that this is meant for longer term investment. The principles of which use many ideas from the great investors, but primarily that of Benjamin Graham and Warren Buffett – and, if you know these investors, we are talking longer term.

    Nick has only provided FTSE 350 as the information is aimed at UK ISA or SIPP investors.

    Here is a synopsis of the filters of the principal figures used: “and, we have to say, principal figures that cannot be found anywhere else” 

    Margin of Safety: price is less than 60% of value

    Age: more than 4-years trading with less than 2-years of negative earnings

    Growth: a growth rate greater than 10% to ensure a reasonable rate of return

    Consistency: 10% growth rate in all variables – consistency score greater than 60%

    (Blackberry conundrum: consistency of growth improves over time)

    You will notice, in the more detailed sheets below, that annual report dates can be over 12 months old. That is because of the release time of annual report information. Although we are long-term investors with this information, Nick will run the calculations every few months to capture annual result information reasonably early.

    Here is the more detailed, and most up to date annual report information, on each of our companies that made the cut:

    snip20170225_2

    snip20170225_4

    snip20170225_5

    Finally, anyone using this information to invest we must, of course, point you to our disclaimer page. Also, it is important that individuals do their own due diligence. It is important that, as investors, we understand the company we are investing into. The information above is detailed but we must determine for ourselves if we think a company has legs for the longer term.

  • The short the medium and the long

    What is new for 2017?

    Firstly, for my day trading from 5-minute charts I’ve chosen:

    EUR/USD  AUD/USD  GBP/JPY  GBP/USD and Gold

    I trade these most days (half day Friday) from 8am to 6pm. With an hour or two off here and there for good behaviour. I will report day trading ideas from time to time through this weekly blog.

    Secondly, for the ‘slow Trader fund’ from daily charts I’ve chosen:

    The UK top 200 shares

    This was after reflection over the holiday period. Trading currency pairings on a higher term chart, when probably taking the opposite view on a lower term chart, is difficult. Therefore, we needed a home for the fund and the UK top 200 shares fits the bill. Why not US stocks? There is a change in tax on US stocks and also we consider that later this year a large move in the dollar is likely. There is enough going on trying to pick share direction – we don’t need to have to factor in major currency changes too.

    I’m excited about this move of the fund. We will trade both long and short based on ‘price action’ technical analysis. It will provide stability and the increase that we’re looking for. I review all qualifying shares every trading day morning. Entries are based on daily charts, however, best entries may be found on lower time frame charts. Ideally we are looking for entries to last a few days out to a maximum of a few weeks.

    I’ve chosen a selection of the top 200 shares that have what I’m looking for in terms of price, liquidity and stability. I will blog the complete list later and keep members updated of results through this blog.

    Finally, we also want to provide information for the best UK pension ever. That is long-term (many years) investment via a UK share ISA.

    This is a reintroduction to Slow Trader of fundamental analysis. Nick has kindly agreed to provide regular information from his spreadsheet on which UK shares are great performers and available at the right price. Nick will be reviewing the FTSE 350 (that is the FTSE 100 and 250 combined) and I will keep you updated from this list. I won’t provide a description of companies, as I’ve done before, but simply the essentials from the spreadsheet. These are for long only consideration.

    This is all about the fundamentals and the incredible analysis tool that Nick has created. However, James and I will add our long-term (weekly and monthly chart) technical slant. More of this soon.


  • How goes it? Week 25

    For simplification, I’ve combined Slow Trader and Ferrari into one fund which we will refer to as Slow Trader Fund.

    Our strategy in Slow Trader is to short term trade (using, primarily, daily close bars rather than intra day bars) shares in the FTSE 350, stocks in the S&P 500 and major foreign exchange (FX) currency pairings.

    Arm Holdings. We came out at a little over break even. I moved our stop as I was not happy with the possible trend change of this share price. The share price did move below our buy point but has subsequently moved up again. We are out for the time being.

    Halliburton Co. We set this share stop also to a little over break even. This took us out without lose and the share price has continued to drop. A good move on our part.

    BT Group. Moving the stop too early is usually not a good thing. I feel that the stop  should only be moved if something happens to make you change your mind about the share or the share price has climbed sufficiently to put you into a different price bracket. I got this wrong with BT. I moved the stop and got stopped out for £17 profit but the share turned and continued up!

    Ashtead Group. – £311 lose. On reflection, not a good share to take. A ranging share price, rather than my strategy of taking trending prices, this share dropped well below my entry price – but has subsequently turned up again.

    CLS Holdings.  – £325 lose. I made fundamental mistakes with this one. Incorrect retracement level without price action. If I had waited (patience is the virtue of a good trader) and measured the retrace correctly this could have been a winner.

    Snip20150620_7I bought at the red arrow, the green arrow was of course the correct buy point.

    Card Factory. – £311 lose. This is a relatively new share. Only 5 years of fundamental information, I prefer 10 years.

    Snip20150620_8

    We were in credit – having bought at the lower green arrow – but a sharp drop took us out. You will notice that I sell a share for a lose (or more accurately, I’m stopped out if a share price drops below what I think is acceptable).

    FX AUD/USD. + £394. This is the first time you have been introduced to FX. This is on an intra day 4-hour chart so you can see the move.

    Snip20150620_9

    We bought at the red arrow, we sold at the green arrow and we bought again (and we are still in) at the blue arrow. Easy! Okay, sometimes it goes ideally like this.

    We also had interest charges (mostly for carrying shares over the weekend) of – £32.

    We are currently in:

    CLS Holdings. We bought again at the green arrow on the CLS chart above. Although the price has moved up we are still -3.7 points as this is the spread. The spread is how the broker (in our case IG) make their money. It is the same as when you go on holiday and change your sterling for euros, you have a buy and a sell rate.

    ITV PLC. + 2.6 points.

    Money supermarket. + 12.1 points.

    Monster Beverage. + 568 points.

    Underarmour. + 464 points.

    WPP PLC. – 9 points.

    FX AUS/USD. – 20.9 points.

    Finally, anyone wishing to short term trade for themselves I am trialling a notification system to help you. You will get my information direct to your smart phone so you will need an account that you can action through your phone. More later.

    B

  • Shares traded this week

    Non of our shares reached their price targets this week.

    We usually only trade shares long (unlike the FX market which we trade long and short).

    The FTSE 350 and S&P 500 markets were generally down this week. Certain sectors like Home Construction had a good week.

    However, the general down periods in the market present us with buy signals.

    The one I got wrong was Southwestern Energy Co. A higher risk share for us as it was early in an up cycle following a large down cycle. It retraced more than I wanted.

    On the plus side, we entered:

    Arm Holdings which we got for a good price and is up a few points.

    BT Group, this is a weak growth share but a positive growth non the less. We are at even on this.

    Halliburton Co, we had a buy limit set on this company for most of the week. We recently got it and it immediately moved nicely up. An oil equipment company but very much dependent on the oil commodity price.

    Monster Beverage had a good buy signal but has moved lower. We are still in this share although my stop position will not allow it to move much lower. Hopefully we’ll get a nice recover in the market and Monster next week.

    Under Armour Inc. was bought early in the week and stayed low throughout. Yesterday however it moved very sharply up in our favour – still some way to go to our sell target.

    A reminder not to use this as recommendations as the buy time on most has probably passed. You would end up buying as I’m selling!

    You can get early information via WhatsApp – more on this later.

    Regards

    B