Category: Slow Trader Hedge Fund

  • Minimise unnecessary loss and sharpen profit taking

    Back to live trading after an exhausting couple of weeks that introduced 7 new hotel rooms to our business. For the extent of the renovation See the hotel blog.

    In trades, we started this week with a day of back testing. We then missed a trade day and later in the week had to change our normal routine to a later trade start of mid afternoon.

    The late start provided a different challenge. You will know of the interest rate change and the sudden effect this news had on sterling. Our trade start time this week was after the interest change news and, therefore, after much of the action had already taken place.

    The reduced activity in the market after the interest rate exhaustion meant that we needed to reduce our chart bars from our usual 5, 3, 2 or 1 minute bars down to 23 second bars. At 23 seconds we could get a read on the chart. The issue now is finding a trade that provides at least a 16 pip move, our smallest scalp in the GBP USD chart.

    Working the 23 second chart is rapid. Strategies have to be clear and decisions decisive. Miss the exit signal and the chart is away from us into ‘no man’s land’ before we know it.

    From that experience this week (Thursday after the UK interest rate decision and Friday after the USA non-farm payroll) we have introduced 3 brief but important points to our strategy page on exits.

    If we hadn’t traded the 23 second chart the exit strategy points may not have been as defined or obvious to us. Using these same exit strategies in the higher time frame charts, which we will do this coming week as our routine is back to normal, will minimise unnecessary loss and sharpen profit taking.

  • At the end of every Friday to have made money

    A small profit this week but most days of trading were lost due to a nationwide BT broadband connection issue. We use BT infinity. You may or may not have been affected by the BT thing this week, we were. What is more, a slow, intermittent broadband connection can be annoying in many cases – in live lower time frame trading charts, its scary stuff.

    ….it’s like steering your expensive yacht through a twisty narrow channel, made up from a flotilla of other expensive yachts, and you have a rudder that is a made from a squishy sponge.

    Coincidently, next week is the final big push week of putting the final touches and furniture into the family business extension. So trading time disruption expected. As we go into August we will be back to six hours a day trading days. And the aim of the fund remains: at the end of every Friday to have made money.

  • The cool headed, eagle-eyed trader

    To win consistently at day trading we need to love what we do, because it involves a lot of screen time.

    Day trading is our prefered trading timeframe because we are in control, on a moment by moment basis – we do not wander off and leave our trade to ‘hope’.

    That said, day trading, more so than the higher, trade and hope, timeframe of trading requires a cool, well rested head. Any sign of tiredness, or distractedness, will show, as clear as day, in our trading results.

    This week, and the coming few weeks, with the opening of our extension to our family business, the distraction and the tiredness is there and we have modulated our trading to balance this.

    Our primary trading timeframe is the 5 minute chart. However, we will use as low as one minute charts to get a better read on a 5 minute chart entry.

    Whenever we see a complete chart the entry and exit points can quite easily be given by an 8-year old. However, to find good entry and exit points consistently, in real-time, requires at least 10,000 hours of dedicated chart time.

    Below is a trade we took yesterday on the one-minute chart. The trade went against us initially, but our wide stop and reading of the chart left us with a profit. Any other trader would have traded differently, and on another day with the same trade we probably would too, but this is how it ‘panned out’ for us.

    Snip20160716_4

    We entered the trade short (that is for the price to go down) with a scalp and a swing at the blue arrow (I’ve saved you from the multiple trend lines and measurements that go into finding this entry). We had a wide stop of 60 pips.

    To the eagle-eyed trader, the ‘price action’, shown in the yellow box, was a signal to get out of the trade. However, we held and it was only at the red arrow (actually, it was slightly higher than the red arrow shows, and therefore slightly slower than the eagle eye!) that I got out of our scalp at a small loss.

    The swing portion of the trade went against us for over an hour where another scalp entry was presented at the green arrow. The scalp entry would be taken off at the grey arrow and the swing at the yellow arrow. In actuality, we did not take the green arrow entry and took the original swing off a little above the grey arrow.

    When a trade does not go our way immediately  (and the law of trading probability says that sometimes they won’t) it needs a cool, well rested, head to deal with it and achieve a profitable outcome.

  • Amount per trade

    A disjointed week of trading. Monday is for back testing, at least for us for the near future. Tuesday was a day of local teacher strikes, so, as I’m considered as not having a ‘proper job’ I’m asked to look after the grand kids. Of course I say yes. Wednesday went well with a full win (I explain full win next). Thursday was not so good with a half loss brought about mainly through poor communication between James and me. We spent the afternoon of Thursday resolving this through back test and practise. Friday was the ‘non farm payroll’ day which comes around every first Friday of every month and which, at present, we don’t trade. The week can be quickly eaten into if we don’t concentrate and dedicate ourselves to the task.

    What do I mean by a full win? This comes from the average size of a market. Normally, we can trade the currency pair GBP USD with between a 20 (near) and a 60 (far) pip stop. (During a non farm Friday up to 240 pip stop may be required).

    We normally have a distant stop of 60 pips and a near stop of 20 pips, and we trade anything in between. We take two concurrent trades per trade entry. The first trade is a scalp (a reward that is at least one times the risk) and the second and concurrent trade which is also a scalp or, wherever possible, converted to a swing (a reward that is at least twice the risk).

    Putting on two trades each time or taking partial profits from a single trade, if your broker allows this, amount to the same thing. Two separate and concurrent trades have advantages but can be difficult to manage.

    Back to our example, the minimum we can trade on the GBP USD is £1 per pip. Therefore, with a stop at 60 pips and two concurrent trades: that’s £60 + £60 = £120 per trade. Each trade must be the same in terms of management and potential loss. With this in mind, a closer trade with a 20 pip stop would require £3 per trade ((20 x £3) + (20 x £3) = £120).

    That is why for GBP USD we have a minimum trade of £120. If our stop is, say, 30 pips or 40 pips then we have to do a quick mental calculation to know how much to trade to retain the same potential, pre agreed, loss per trade.

    Trades for us grow exponentially. As confidence in our trades grows, and if we can retain the ability to trade without the amount on each trade emotionally affecting our decisions, then our trades will build as follows: £120 per trade (£60 + £60 risk), £240 (£120 + £120 risk), £480 (£240 + £240 risk), £960 (£480 + £480 risk) ……and so on and so forth – but then we need to consider spread and the effect this has.

    Each of the above represents a full win. At present we trade £240 (£120 + £120 risk) per trade.

  • ‘slow trader’ moves to day trading

    I am taking our ‘Slow Trader’ hedge fund out of commodities and any medium or longer term trades. We are going fully into day trading and trading a single item – which at the moment is the currency pairing GBP USD.

    (Medium term trading of commodities is an excellent way to trade, but we need to focus 100% of our efforts and, for us, that is day trading).

    It is not possible to day-trade until a trader reaches a certain stage in his or her ability to read and manage in the lower timeframe charts. I think that we are close enough now to this ‘stage’ that we can touch it.

    To believe that it is possible to day-trade the lower charts is like asking some of us (non athletes) to run a 4-minute mile. If we did not know better, because we can watch the olympic games, we would quickly conclude that the 4-minute mile is unachievable; we would probably give up and defend our egos with comments such as ‘it’s not possible’.

    For those that do achieve the 4-minute mile (incredible as that is) they will get nothing from it other than personal satisfaction. That is because all the wins, the glory (the profit) is being able to go a few seconds under 4 minutes.

    In our day trading we feel that we are now achieving the equivalent of the 4-minute mile. We are now day trading where we can almost guarantee a break even at the end of the week. A shout of ‘well, yippee for you’ is justified, but all the work goes into the foundation. To push the running analogy further – once we see ourselves achieving the 4-minute mile, only then can we believe that we can get a few seconds under.

    Why favour day trades over medium term trades? For us it is because day trading is clear and finite. Trades are completed before the end of the day, and certainly not carried over a weekend. You are not waking up to a real shocker. In Andrew Tobias’ (updated) book ‘The only investment guide you’ll ever need’, he explains how he was in a hedge fund that after 5 years increased his fund 4.5 times – soon after 5 years it was at zero. And that is the thing with hedge funds, the unpredictable explosive nature – both up and down.

    My aim is different to this. I want to increase our fund in a regular (almost predictable) way, week on week. The hard work has been done, all we need to do now is manage those extra seconds.

    Our trading desk:

    IMG_1321

  • Retail traders stay out!

    What a week….and, no, we didn’t make a killing on the pound but nor did we lose anything.

    Retail traders (people who trade their own money) were strongly advised – and correctly so – not to trade the early morning of the vote results. Here’s why:

    Snip20160625_1

    Firstly, a trade we took late morning of the day before the vote results, the 23rd.

    When you see a chart after the event you wonder how you didn’t realise that it wasn’t going to go up. We went short (to say the price was going to go down) at the green arrow. One of our strategies is to short at the top of a ‘trading range’. The green arrow was the top of a wide trading range.

    The price, however, broke out long. Our stop, as per our strategy, was equal to the height of the trading range which was over 65 pips. The break-out long went over 50 pips before it pulled back, very suddenly, to give us a break-even out.

    I mention this to put things into perspective. Usually, in GBP USD, our stops are between 20 and 40 pips away. Even early on the 23rd we were up at over a 60 pip stop. Not only that, margins change so that the leverage that you get to know is now different which means if you get it wrong your whole trade can be cashed out very quickly by your broker. Spreads (we mentioned these a couple of blogs back) go through the roof and, most importantly, we have the great probability of slippage where, simply put, you can ‘lose your shirt’.

    We do not trade the monthly FOMC report because price can bounce 150 pips one way and, often, immediately reverse over 150 pips the other way. The early hours of the 24th the market moved over 1,700 pips with over 500 pips of pull back.

    Trading is a ‘zero-sum game’ which means that one person’s gain is another person’s loss. Institutions lost many billions the other night and retail traders trading could have blown out their accounts and more. If you use a retail trader that made money through the big move down then get rid of them as they are gambling and next time might not be so pretty.

    In the chart below, to put things into context, the red box was the time of the large bars shown in the chart above.

    Snip20160625_2

    Gold

    For the next few weeks, due to the expansion of our family business coming on-line, I’m only trading between 8am and 1pm. This allows me time to trade the currency pairing GBP USD only. For the time being I’m monitoring the commodities. Gold moved up to an exact measured move of the previous leg. Something James had spotted – and I’d relayed the possibility of, a few blogs back – and thus providing a great short opportunity. Over the next few days we may get a second (and therefore more secure) opportunity to short gold. But I need more evidence that the price will not go up further.

    Snip20160625_3


  • Learn the language

    Finding our trading style is important. Most of us bounce around different trading systems, methods and personalities looking for what is right for us. And what is right for us is not necessarily right for many other traders. The combination, and therefore choice, of indicators, methods, timeframes and systems is massive. To stumble across a way that matches our personality, time and commitment is probably not going to happen immediately. Most of us (and certainly me included) try everything that we can find – thereby being driven by the personalities of the people encouraging us to use (and pay for) their system or method. This is a time-wasting and expensive way to go about things. Not only expensive because we pay for the system, but also because if the system does not suit our personality then the expense comes via our inevitable trading losses.

    It only occurs to me now that instead of simply following the suggestion of a well-meaning friend or well worded promotional material (or whatever) we should analyze ourselves and find what would be best for us. At least narrowing down the search so we have a better chance of finding whats right for us. The same applies to investors to a large extent. The mystique surrounding trading makes us reluctant to make our own decisions, as we feel that we don’t know enough about it to decide, and it is far simpler to just follow a suggestion from someone who claims to be very successful at it. Well, that is a rubbish way to go about it. The basics of trading couldn’t be simpler, but is made difficult by its language; therefore, the first thing to do (as a trader or investor) is learn the language.

    You will be surprised at how simple trading and investing is, once you get past the coded words. I said trading couldn’t be simpler, and that is true, but transforming that into something that provides a consistent profitable return is quite another thing. But there I go, like everyone else, bringing in the mystique again!

  • Control the losses

    To lose only as much as we win is a good thing.

    Not being able to control losses is one of the reasons many traders have a reducing account; it’s all about controlling losses.

    We’ve day traded a single currency pair (GBP USD) this week. We traded well all week but took a loss yesterday afternoon. We allowed emotion rather than strategy to influence us. There are lessons and reasons why we allowed the emotion to happen but the important thing is that the loss was measured. That is, it was in proportion to our gains.  All too often with inexperienced traders losses are disproportionate to the gains. Constant awareness of probability, risk, reward and therefore the traders equation is the most vital skill in the traders tool bag.

    Why just trade the one market? it is possible to day-trade multiple markets but by doing so the trader can only employ a limited number of trading strategies. We are not computers and therefore we need to compromise. The balance is markets traded to strategies employed: more markets equals fewer strategies and vise versa.

    Personally, we prefer to day-trade a single market with multiple strategies. This, on average provides us with 4 or 5 trades per day. Within those trades we will take swing and/or scalp trades depending on market cycle and context. (A swing is a trade on our chosen chart that allows for a pull-back. A scalp, once the trade has taken, will not allow a pullback).

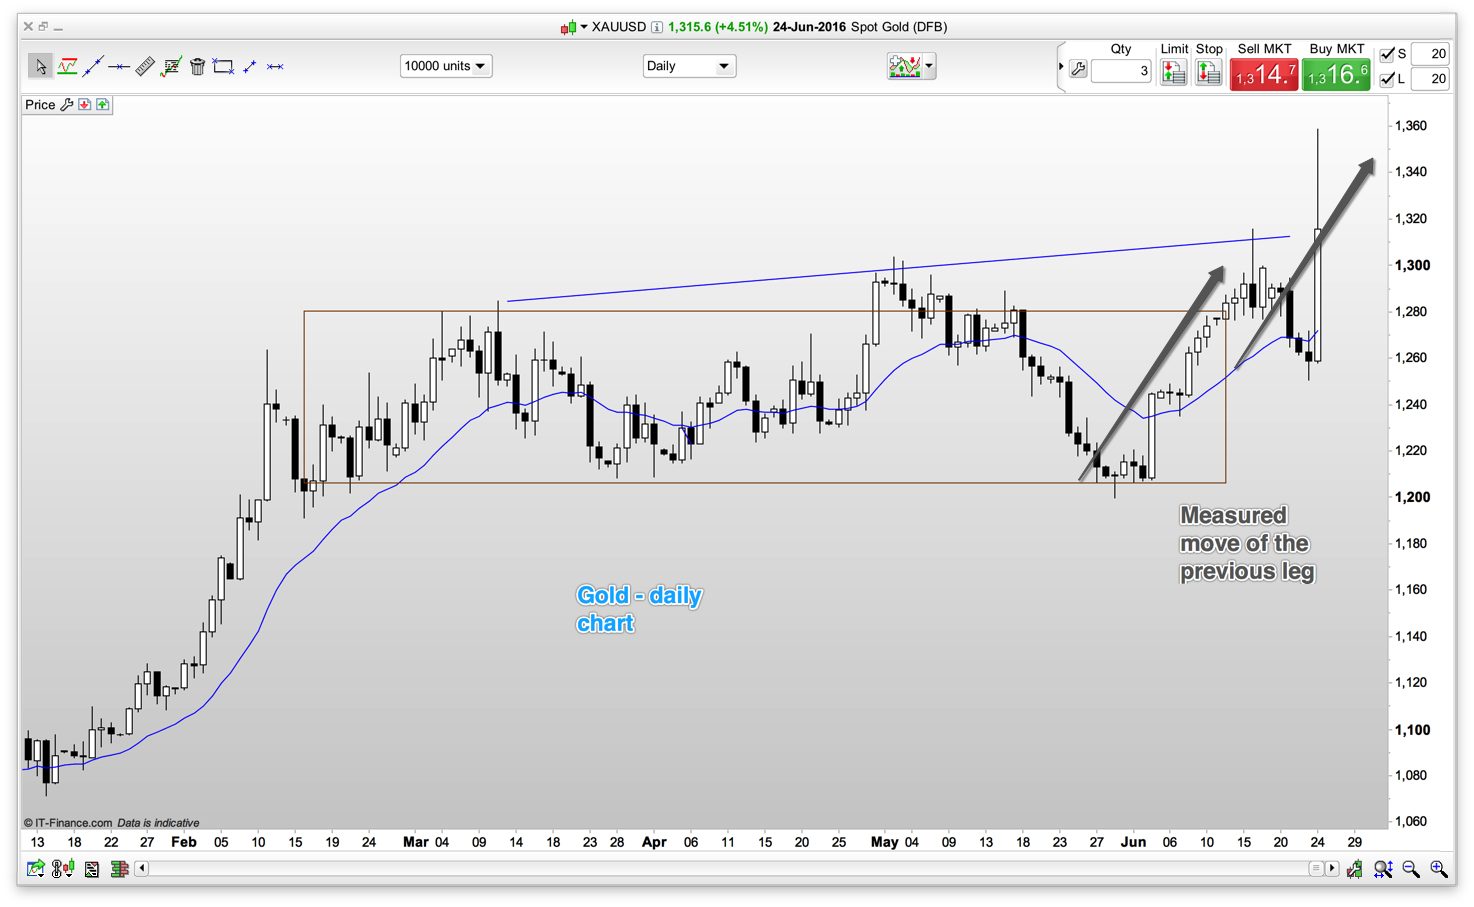
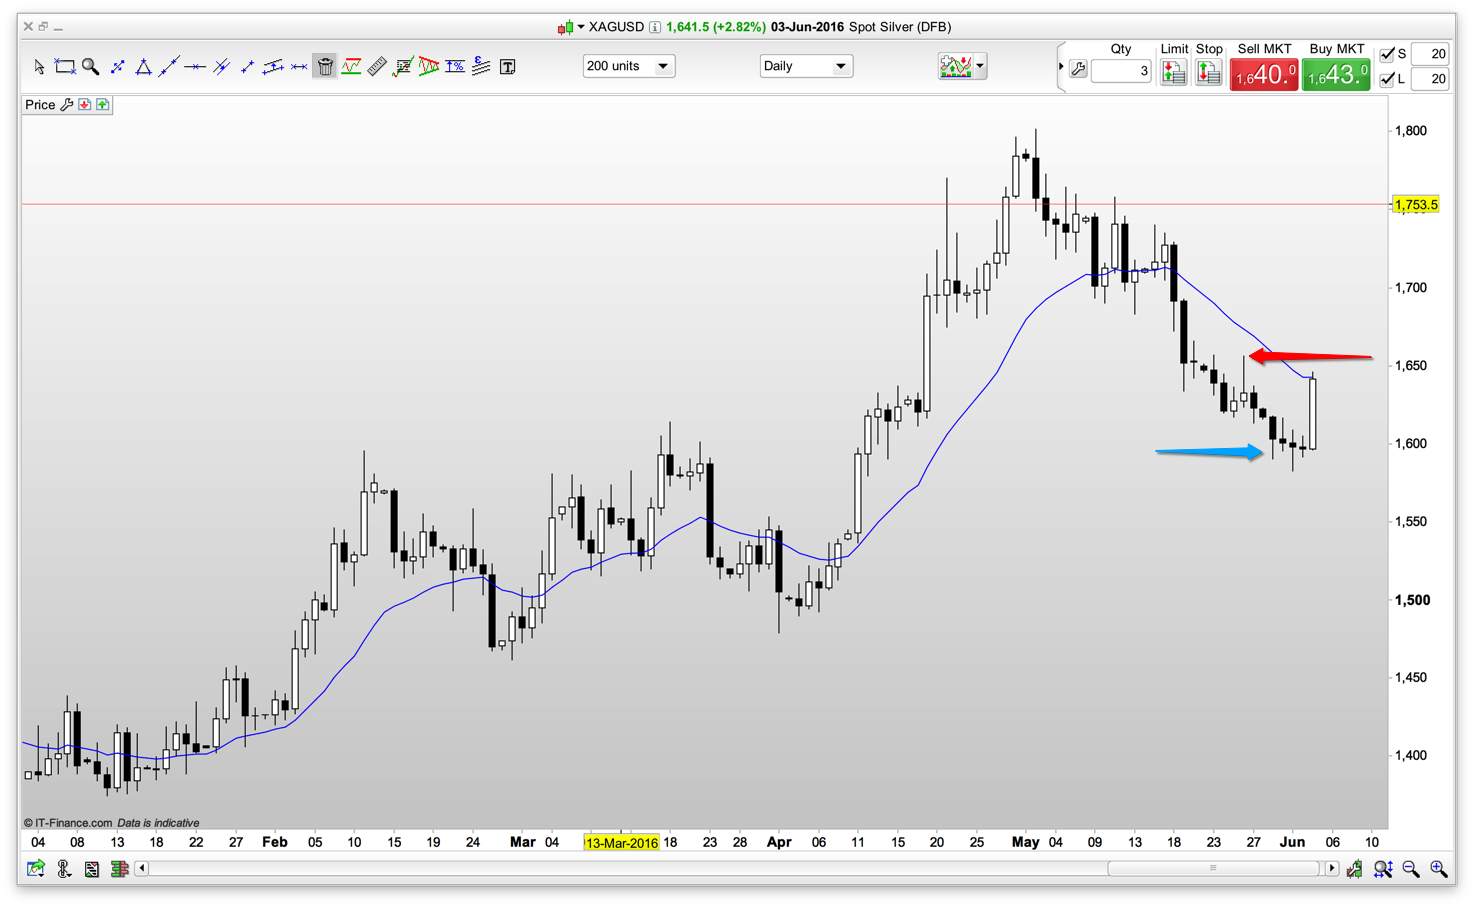
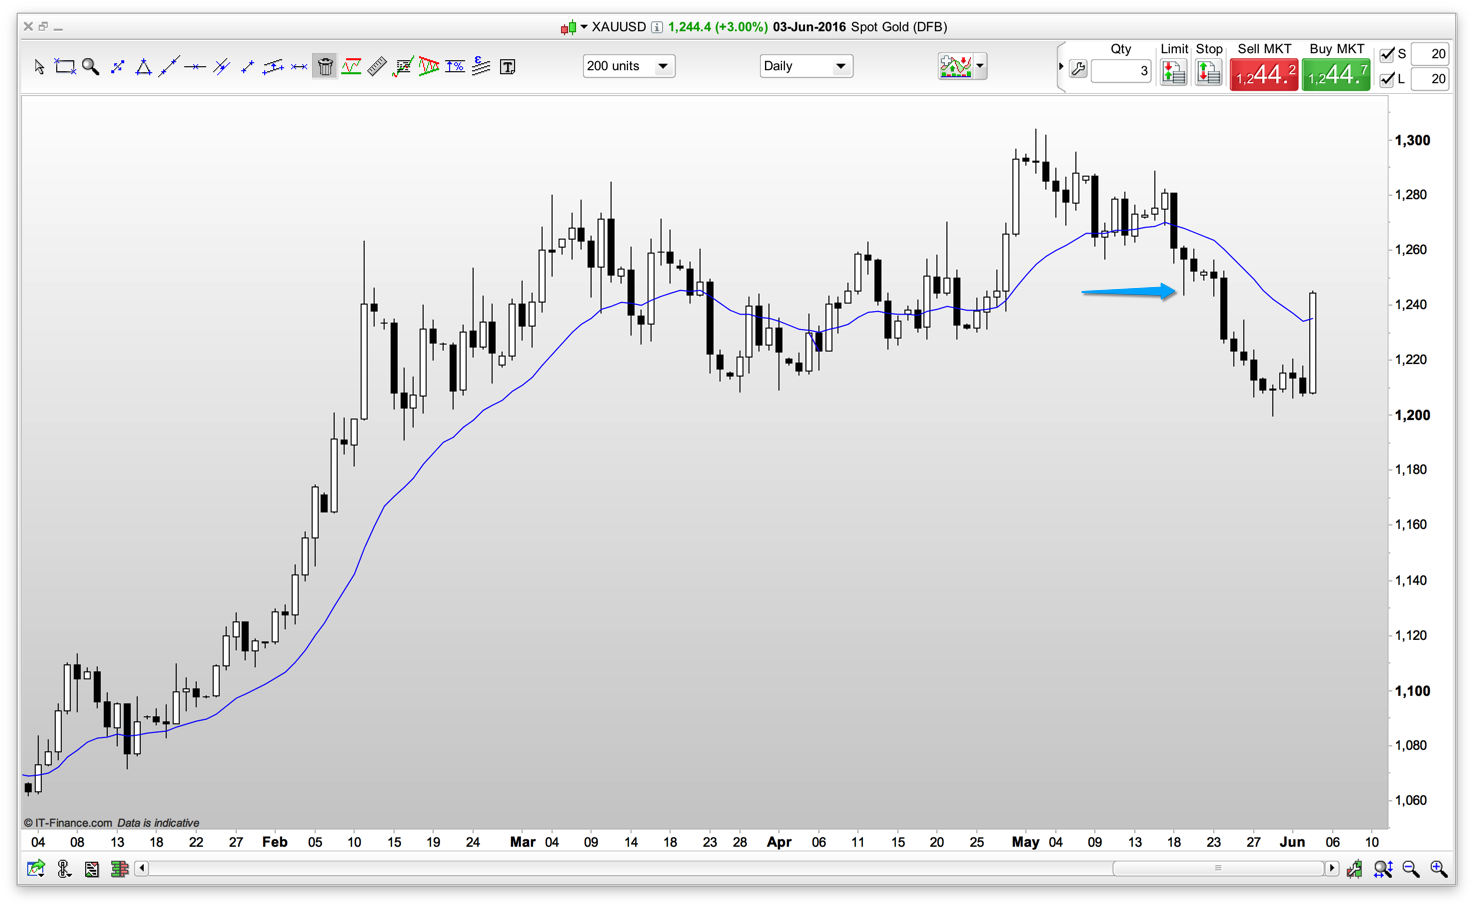
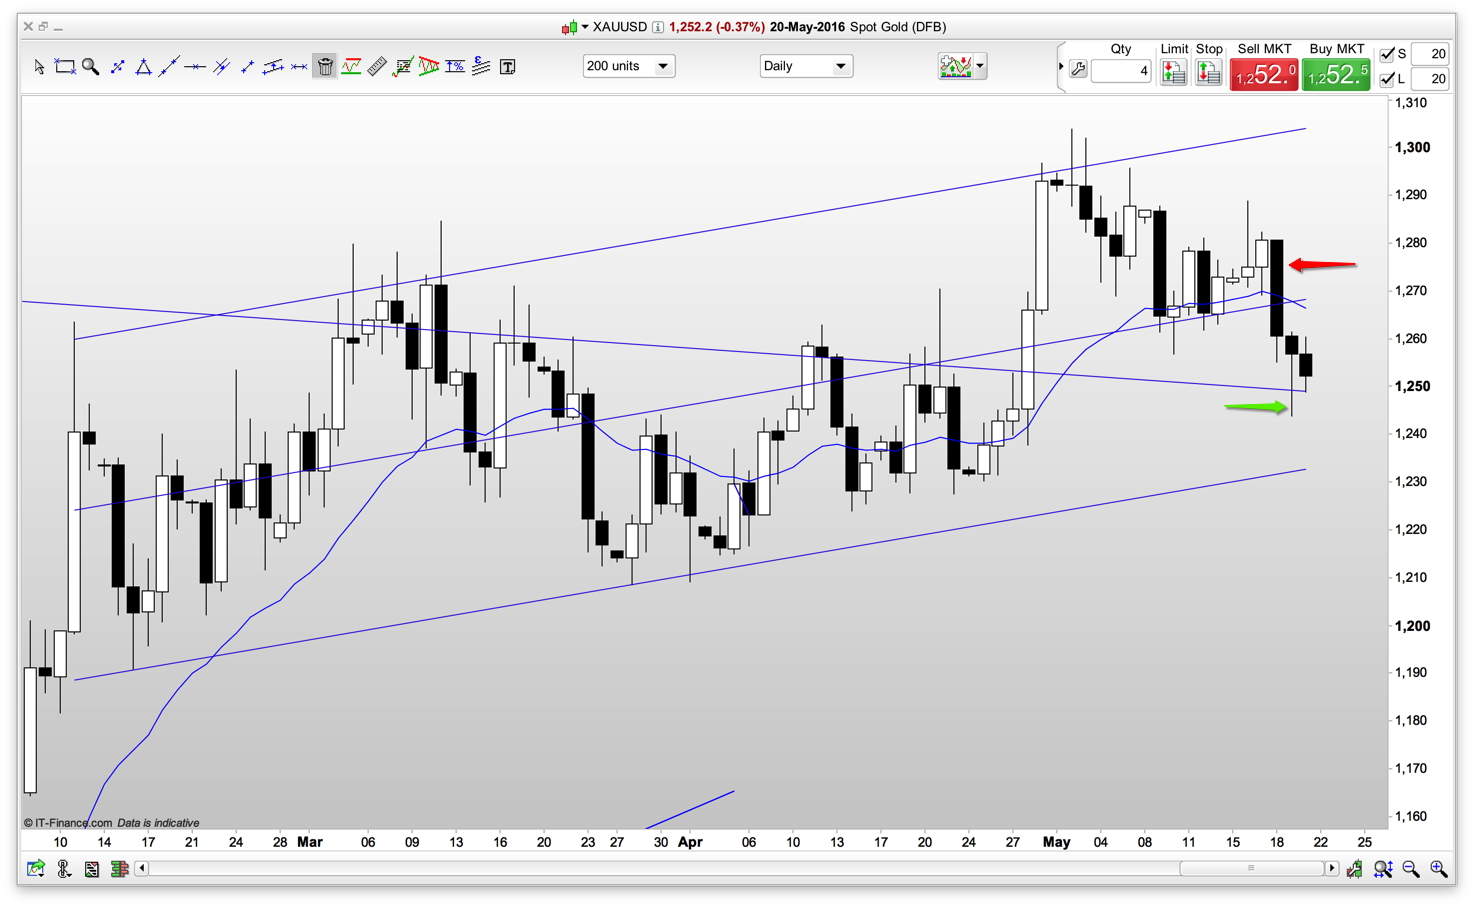
    (I have left the commodities for the time being to work on day-trading GBP USD. As an aside: gold and silver have done what we said. I would not trade the interim climb in gold and silver as it goes against the principle direction of the COT report.)

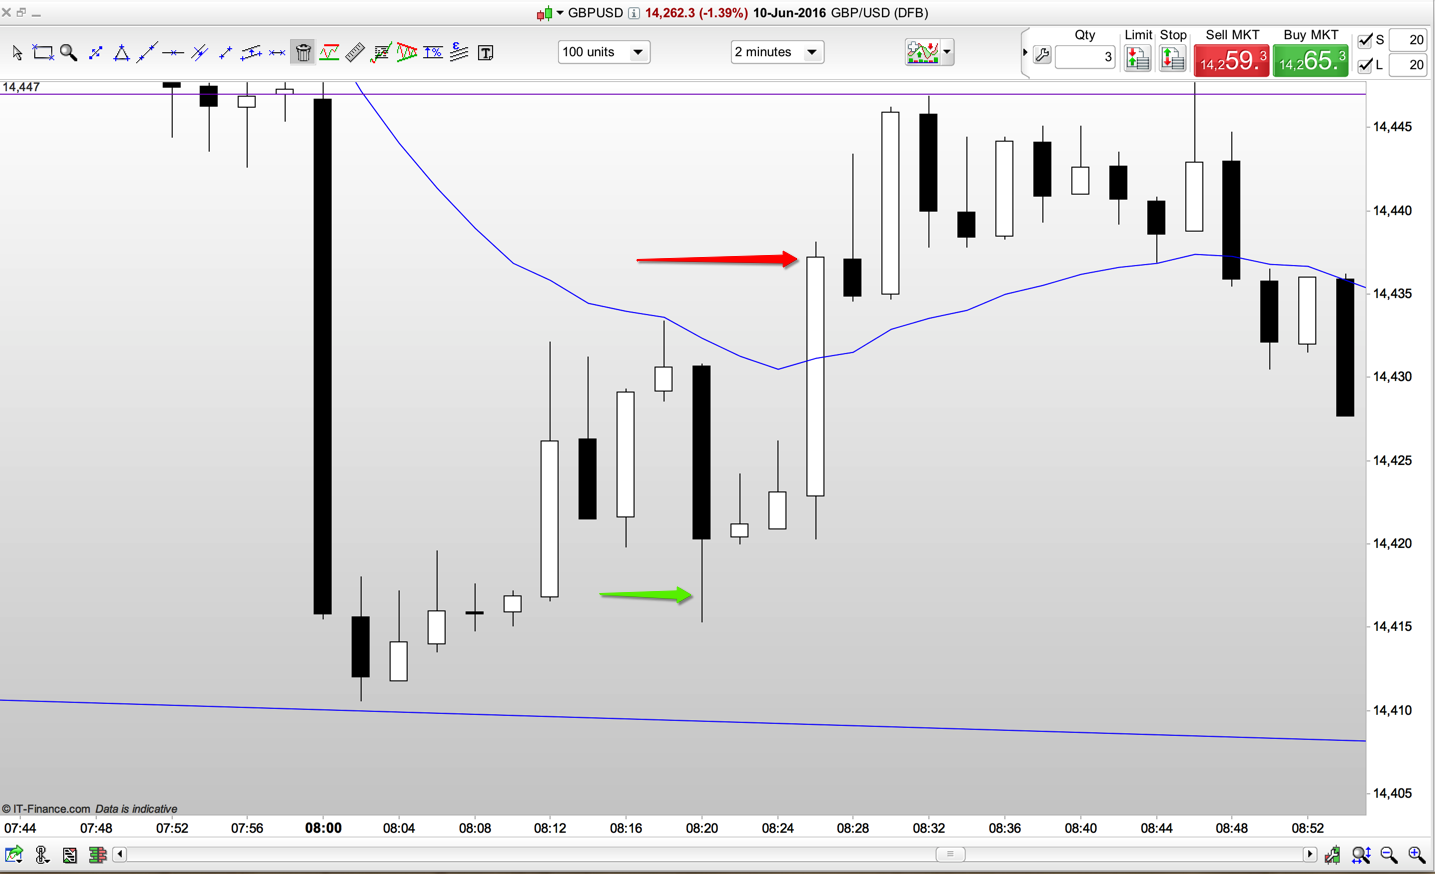
    Our issue with day trading the fund is “spread” relative to the size of the trade. The spread, the difference between the ‘buy’ and the ‘sell’ price, becomes an issue with day traded larger accounts. Let me explain from a trade we took yesterday morning.

    Snip20160611_4

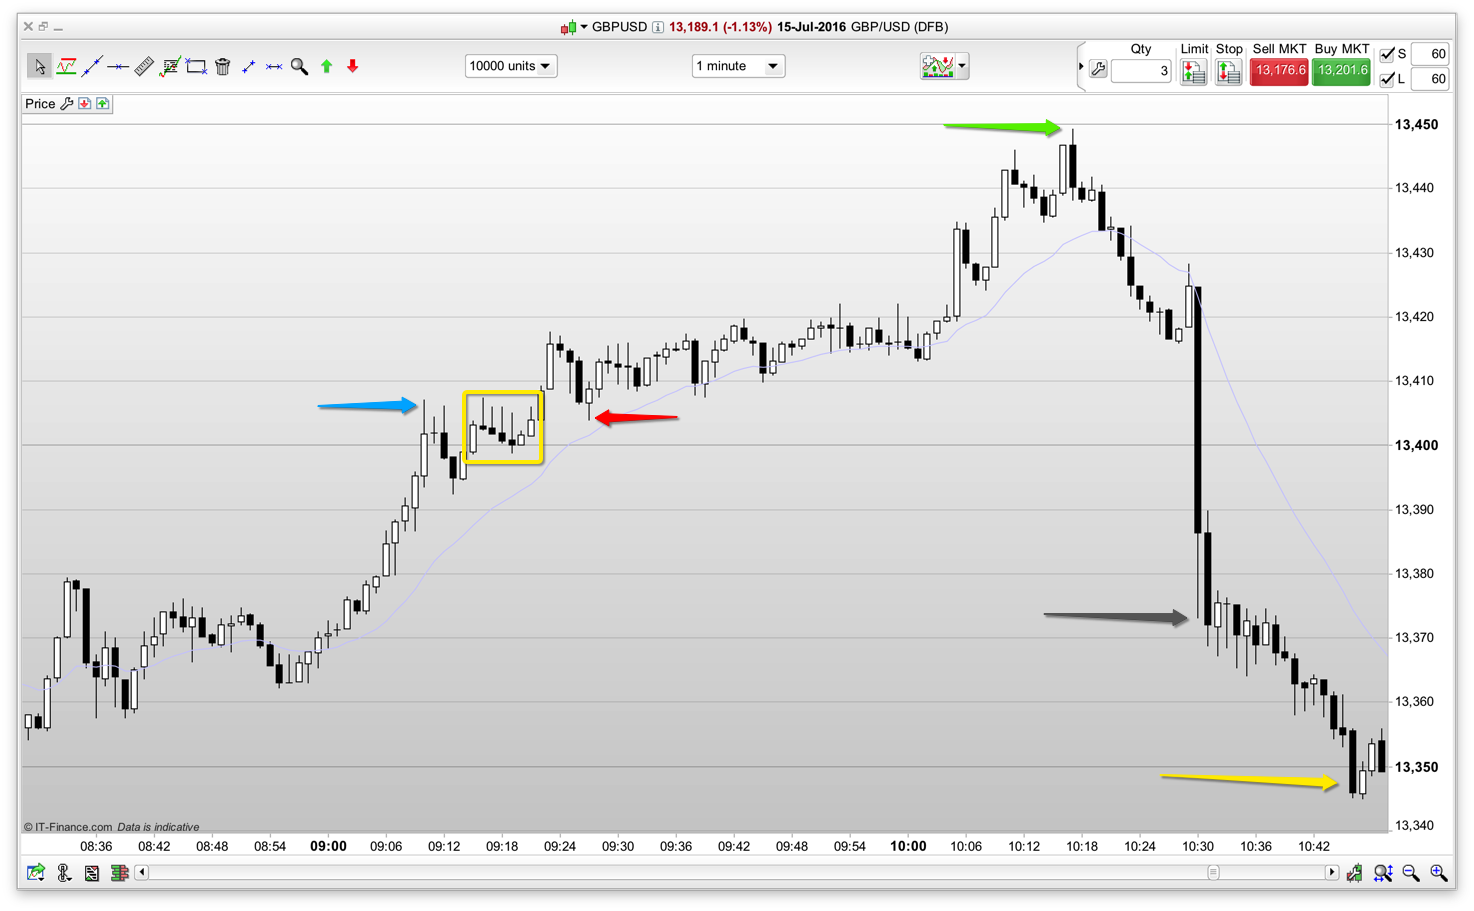
    This is a 2-minute chart for clarity. We entered the trade (long) at the green arrow. We exited the trade a few minutes later on a scalp at the red arrow. Okay, here’s the issue. We mentioned last week about spreads. When we bought at the green arrow the spread was one pip so our green arrow was placed 0.5 pips higher than our ‘buy’ position. When we sold, at the red arrow, the spread was 2 pips so we got an exit price that was one pip below our actual exit. The actual trade was 21.5 pips to us. The spread accounted for 1.5 pips leaving us with 20 pips of profit.

    At £6 a pip the trade gave us £120 worth of profit. Our broker took the 1.5 pips difference (or £9 in this instance) for themselves. Coincidently, this trade provided a one to one reward. Our risk was £120 or 20 pips. This is the minimum scalp that we can take to make the traders equation work in relation to the broker’s spread size.

    Only taking swings, and therefore aiming for a greater number of pips, proportionally helps the spread dilemma. However, with our fund size we need to build our risk and to do so makes the spread even more so of a consideration. Let’s take a full trading risk per trade of say £480. In this instance, with the same trade above, the broker’s spread fee would have reduced our profit by £36. And that is expensive.

    For the larger account, financial spread betting is not ideal. However, balanced against the leverage, flexibility and the tax (being free) benefits it is still the best trading vehicle for us.

    How to improve our lot? As our risk size increases (and probably not until after the Brexit vote) we will change brokers to a pro account. This involves moving to a different chart set-up which will need time for familiarization. However, the spread benefits are worth it. In the £480 risk example above. In the pro account that we are considering the trade could have cost us £16 for the spread, plus £4.50 for each trade, making a total cost of £20.5. Still not cheap, but better than we presently have.

    The pro account only benefits the higher volume trades.


  • Brexit, are we going to trade it?

    Before Brexit here’s gold and silver last week.

    You will recall that we are only looking for short positions in gold and silver. We took profits in both nearly 2-weeks ago and have been looking for an opportunity to take a short since then. Although both gold and silver crept down and tempted everyone to jump on board, this would have been hopefulness.

    Here’s silver: silver provided a short signal which I missed, and mentioned last week. That would have given us a profitable move down and exit at the blue arrow. However, without a clear ‘short’ context the danger was always the strong pullback, which happened yesterday, and that is why it was correct to not hold our original short too long. The pull back may just be to the moving average, shown by the blue line, or a move to equal the previous high at 1,800; or, significantly higher with a measured move of the previous leg. We will need more information before acting.

    Snip20160604_1

    Gold below shows the short that we exited on 19th May. I was somewhat quick as the second leg down would have doubled our profit. However, the move up yesterday (similar to silver) has brought the price back to our ‘buy back’ position on the 19th. As the climb yesterday has closed above the moving average I’d expect more upwards movement next week before providing a short opportunity.

    Snip20160604_2

    How will Brexit affect our trading? As an aside, one issue we have with trading gold and silver, particularly with a reasonable sized fund, is the size of the average bars (potential movement of price on average over a certain time period) in respect to spread. If you have bought shares in a SIPP before you will know that your broker charges you anything from £5 to £14 per trade. That is why you need to buy a certain amount of shares otherwise your broker’s fee represents too high a percentage against you. The same is true in reverse with spread betting.

    Silver, for example, has a spread of 3 pips. That is, for your buy/sell you will pay 3 pips at whatever price per pip you trade. If you trade £1 per pip, then, from the broker’s perspective, you are charged £3. (Not actually £3, you will notice that your entry line on your chart is 1.5 pips to the negative as will be your eventual exit line – with both together equalling 3 pips). That’s fine at £1 per pip, and actually a good deal. However, you ain’t going to retire soon on £1 per pip in silver. Our fund trades more in the region of £10 to £20 per pip; and that represents a high broker’s fee if the trade goes against us.

    Far more representative of average bar size – when compared to spread, and also compared to the amount we wish to trade – is the currency pairings GBP USD and GBP JPY. The spread on these are about 2 pips and 3 pips respectively (I say ‘about’ because they do fluctuate, particularly in times of high volatility). However, typical corresponding bar sizes of the above currency pairings (GBP JPY being the biggest) are 10 to 20 times bigger than say gold or silver. And that is why we need to move most of our fund trades to the currency pairings.

    That brings me to the initial question, how will Brexit affect our trading? Clearly we all know that it will be a time of high volatility in GBP and anything in association with GBP. To that end, the spread will increase significantly. This will need to be carefully monitored. But spread increase is okay if average bar size increases in unison. Brexit could provide a lot of barbed wire (bars that bounce up and down but close fairly tight and don’t actually go anywhere) or, of course, it could set-up a great trend. My own thought is that it is going to be a bit of both and we need to read the movement well to take advantage. So are we going to trade during Brexit? probably not on the 23rd June, but for the run up – most certainly we are.

  • A neutral few days

    A neutral period looking for re-entry opportunities, but nothing taken this week.

    USD CAD seemed to take-off only to pull back to the weekly support line. A good buy opportunity now – or a few pips lower.

    Brent crude oil is at a position – that we projected a few weeks ago – that is ready to short. We will take shorts from the hourly chart (rather than the daily) as we feel oil is more easily managed from the hourly (rather than the daily) chart.

    Silver provided a reasonable re-entry short opportunity on Thursday. Missed that, but a second chance may present itself again this week.

    Gold has dropped just over 30 pips from where we took profits at the end of last week. Now likely to drop a further 20 pips before meeting a monthly resistance line. If we get a retrace we will take a short as gold has the potential to drop a further 70 to 150 pips over the next few weeks.

    We have listed a new page called strategies. This is written (and added to and changed most days) in a short format – as if we are preparing the ground for a computer algorithm. Therefore of little meaning to a non trader. However, it provides an idea of the precision involved.

  • Profitable gold and silver – missed USD CAD

    A good week with profitable trades in gold and silver. The week did come with a small loss and missed opportunity in the currency pairing USD CAD. Also, we were out of the money for much of the week in crude oil only to grab a brief break-even buy back moment. Overall, a good week.

    Silver daily chart: each bar represents one day’s worth of trading. A black bar means the price closed lower than the open. Each candle (as they are called) shows the open and close price and the wick (either top or bottom) shows how high or how low the price actually went between the open and close times.

    Snip20160521_1

    We shorted silver at the red arrow and we bought back that short at the green arrow. Just over 80 pips of profit for us; a pip is the smallest upwards or downwards movement. (In stocks and shares it is called a tick.)

    Gold daily chart:

    Snip20160521_2

    We shorted at the red arrow and bought back our short for a profit at the green arrow. Gold trades less than silver per ounce and therefore our gold movement this week represented only 30 pips. However, the smaller size is offset by the traders equation: based on probability, our profit target, how far away our stop is and the representative amount we’re prepared to lose.

    USD CAD daily chart:

    Snip20160521_3

    Over the last few weeks we went long at the larger green arrow and took our profits at the larger red arrow.  We went long again a few days later at the smaller green arrow only to be stopped out of the trade (within a couple of pips!) at the smaller red arrow for a small loss. I then missed the subsequent move up. That is trading. Did I set my exit stop at the wrong place? Maybe. Hindsight is a wonderful thing, and a few more pips below the moving average would have been sensible. But my overall judgement was correct, in that the price was going to go up – and I take confidence from that.

    Crude oil daily chart:

    Snip20160521_4

    My best trade of the week without making any profit. Let me explain. We shorted at the red arrow and were out of the money all week to the tune of 200 pips at one point. We bought back our short at break even price at the green arrow. Best trade because although we were out of the money we did not reach our stop position and we managed a break even price. Ready for the next one!


  • gold and silver – are prices ready to drop?

    Copper – An uneventful week for the commodities. All except copper which moved down without us and with gusto. Copper, however, had an unclear read on the COT (often the case with copper) and an unclear read on the daily charts. Therefore we are correct to be out – as to stay in would have been to rely too heavily on hope.

    Crude oil and USD CAD – We hold a small position on crude oil short. But a 200 pip climb is likely and at which point we may add to our shorts. USD CAD, which often reflects a delayed but exact opposite price movement to crude oil, shows a clearer picture. Too much reliance on the difference between these two charts (crude oil and USD CAD) is, however, a ‘chicken and the egg’ question and should be considered but not relied upon.

    Gold – Having taken some profits (short) from gold last week we continue to hold a small position short. Expecting to add to shorts anytime this week. Net position of the commercials remains at a 5-year low. This will provide great momentum to a drop in the price of gold if gold price per ounce falls to the $1,200 region.

    Silver – Similarly with silver. We took some profit last week and continue to hold a small position short. Looking for a price climb to $1,730 before adding to shorts. Silver, however, has an even more dramatic picture on the COT as the net position of commercials is at a 10-year low. As with gold, any significant reduction in the price of silver will probably result in an exaggerated acceleration short.

    Intraday strategy – As an aside, much work has been done this week developing our short-term momentum strategy (namely using GBP USD intraday charts) on trading range breakouts and subsequent channels. I know this doesn’t make a lot of sense to the investor, but to a trader it is a high probability strategy with measurable risk and reward. And possibly the most lucrative of intraday strategies.

  • We take some profit from gold, crude oil and USD/CAD

    Until now we have traded the commodities: gold, silver, copper, crude oil and USD/CAD on a weekly basis. That is referring to weekly charts and a weekly COT report. We have also, as discussed last week, considered introducing the fund to intraday trading.

    Each of which (weekly and intraday) are rather on the extreme. On one hand, we have the overly slow weekly chart market, and on the other, the rather demanding intraday market.

    The balance for the fund is daily charts. Why? …weekly charts are emotionally difficult as we see good profit generated only for that profit to disappear as we remain invested in order to reach our target. There is no compromise here, because to take profit before a target, unless our premise changes, does not provide a traders equation (that is: the trade had more risk than reward).  Over the longer term this would be a losing strategy.

    Gold and silver have emphasised this over the last few weeks where they dropped in price to provide us with good profit potential, only to extend higher than I considered.

    Daily charts, rather than weekly charts, usually means tighter stop positions and therefore lower risk, but in contrast our targets are shorter. Timing wise we are in trades for a week or three rather than several months.

    The COT suits the weekly charts, but often goes against my daily chart readings. This of course happens at all levels of chart, for example, the difference between the daily and the 4-hour chart or between the  5-minute and the one-minute chart. However, I report weekly and to have a profit at the end of one week only to know that profit will go away as we wait for the bigger (targeted) profit seems emotionally foolish.

    With moving to daily charts, our targets are closer and therefore we can take profit more regularly (if available) and wait for the next entry. This means that we will occasionally miss the big move – but trading is rarely perfect.

    This week we took profit from our short in gold as it sank from its high of the previous week – and before Friday’s monthly non-farm payroll brought it up again. Also, we took profit from a short in crude oil as it came down over the week and from our long in USD/CAD as, conversely, it climbed nicely over the week.

  • Gold and Silver finish week on a high

    Silver finished the week on a strong move up. Silver is at, or slightly above, a three-year trend line. The COT shows the net position of commercials at a multiple year low; meaning the majority of commercials (the big buyers and sellers) have short positions on silver. As do we. Difficult to hold through, but that is the strategy.

    Gold provides, as it so often does, a similar picture to Silver.

    Crude oil ventures up towards the position suggested on my charts last week. A possible short on crude may present itself this coming week.

    USD CAD had little movement in weekly chart terms.

    Copper dipped early in the week and gave us a reasonable out position. Copper reversed back up by the end of the week as anticipated.

    The strategy on commodities is to go long or short reasonably early based primarily on commitments of traders (COT) information and supported by analysis of weekly charts. We use weekly charts as that corresponds to the weekly COT release. The COT is released UK time late Friday evening and is based on the previous Tuesdays collation of information by the CFTC.

    This strategy often calls for a significant period of time, several weeks or even months, where the trade is out of the money. Treat the COT as turning a large tanker ship analogy – it ain’t quick!

    To balance this ‘slow’ strategy we’ve decided to include a portion of the Slow Trader fund in our intraday trading. That sounds fancy, but is just a way of saying we trade with charts that are incorporated within the day. In our case 1, 2, 15 and 60 minute charts.

    In this instance we take as many as 9 to 15 trades a day and normally complete all trades before the end of the day. I’ll discuss our strategies for intraday trading in next week’s blog.

  • Copper, Gold, Silver, Crude Oil and USD/CAD this week

    Copper has had a strong week and finished high. Silver in particular has spiked up. Gold also increased but finished the week more or less even. Crude oil has finished the week reasonably strong. USD/CAD is still some way from turning up and will need careful management.

    Here they are in slightly more detail:

    Snip20160423_2

    My premise on Copper has changed. Copper, I feel, is some way from a big turn down. I would consider a small increase in price before a drop to our low 2 weeks previously – and then a possible climb. We will look for the best price to exit our copper trade.

    Snip20160423_4

    Silver has had a dramatic couple of weeks. Two strong weekly moves up taking silver from the one year trend line to the, higher, 10-year trend line; indeed, the price of silver bounced exactly off this line – marked with a circle. Always difficult to short when everyone else is long. But that is exactly what we did. Of importance, and supporting our case, the COT for silver shows commercials at an 8-year record with the number of shorts compared to longs. Hold onto your hat!

    Snip20160423_5

    Gold has not been as dramatic as silver. Up in price all week, gold finished low for the week supporting our prediction of gold progressing further down in price over the coming weeks.

    Snip20160423_6

    I’m a supporter of a drop in price again in crude oil, but it may take its time. Price possibly getting to somewhere marked by the red circle. For now, we remain on the sidelines.

    Snip20160423_8

    USD/CAD price mirrors that of crude oil. Therefore, a trade on both is double the risk and a significant consideration. As with crude oil short, it is early days to consider USD/CAD long. A turn somewhere in the green box however is a good probability. But risk reward is excellent when we catch a trade early. Probability is the other major player in the traders equation; moreover, good management of early trades is essential.