Author: Buzz Lightyear

  • “We seem to be living in the riskiest moment of our lives”

    Richard Thaler, a behavioural economist, received a Nobel prize. Speaking by phone on Bloomberg TV, he said:

    “We seem to be living in the riskiest moment of our lives, and yet the stock market seems to be napping, I admit to not understanding it.”

    From our fund point of view, we have a couple of lightly traded shares awaiting conclusion, otherwise we are 100% short-term (both long and short) trading of a chosen currency pairing.

    We have traded GBP/JPY, changed to USD/JPY and currently we trade GBP/USD. Another consideration for us is AUD/USD.

    We moved from GBP during Brexit and for the months after.  With regard to price, JPY is consistent, a requirement of our strategy; unexpected volatility is not, therefore the decision, for the time being, to move back to GBP.

    We do not hold overnight, so poor liquidity during this period, and an increased probability in a spike in price, is not a consideration.

    Trading equities can be very different to currencies, specialization is appropriate.

  • Is it time to worry?

    The Economist have an article this week that asks “prices are high across a range of assets. Is it time to worry?”

    Before the 2007-08 financial crash I managed to cash-in everything that would have been exposed to the crash. This, I’m sure, was luck. I was, at the time, financing a business build; fortuitously, I went much further than cashing-in assets required to support the business.

    Some lost up to 50% of their worth during the 2007-08 crash. (I learnt recently, on their son’s visit to the UK, that this had happened to someone who I had known very well and who now resides in Australia.)

    As the Economist alludes, should we be concerned now?

    I spent nearly a year in the development of fundamental formulae based on Benjamin Graham’s ideas. His method principally determined a ‘margin of safety’. As the Economist article explains: “the price paid for a stock or a bond should allow for human error, bad luck or, indeed, many things going wrong at once”.

    In my technical trading, which is the only trading I now do, ‘margin of safety’ is everything: (1) I do not carry a trade overnight and certainly not over a weekend. (2) The risk of each trade does not exceed a maximum. (3) I cannot multi task, so I trade only one thing, watch it in the moment and with awareness of what (news) might affect it.

    Not many have the will, the time or the inclination to do what I do. I understand that. So we use traditional fund managers.

    Graham’s ‘margin of safety’ was buying a share at a 50% discount or better. can we get that deal today? If not, fund managers may become increasingly incautious in their dealings.

    Buffett said this week, as reported by the Economist, “stocks would look cheap in three years’ time if interest rates were one percentage point higher, but not if they were three percentage points higher”.

    In the meantime, for my fund investors, I’m very happy to take ‘margin of safety’ into my own hands.

    P.S. My articles are few and far between currently as I work on a strategy e-book and of course my trading.

  • Learning from mistakes

    Part of the start of the story

    “Since I have traded full-time, I have gained a lot more experience, mostly by making mistakes and learning from them. I learned that failure is, on the whole, due to not accepting and successfully dealing with realities.

    Achieving success, on the other hand, is a matter of accepting and successfully dealing with all my realities. I believe that great financial traders become great by looking at their mistakes and weaknesses and figuring out how to get around them.”

    The story

    Under the heading of ‘how to make a living trading the financial markets’, and password protected, I recently started to present what is for me an exciting yet simple financial trade strategy. Exciting because it works.

    However, strategy alone did not tell the whole story. If strategy is part of the middle then to be complete the story needed a beginning, the rest of the middle and an end.

    My trading principles, lessons, stratagem and guide are all gifted from mistakes. It is nearing completion. I feel it would be a mistake not to get it finished and get it out there.

  • How to make a living trading the financial markets

    After the holiday season, and over several posts, my aim is to show how to make a living trading the financial markets. I will try to show:

    • How to harness gut feeling, the most important of instincts.
    • How to turn most trades into a positive outcome, a decisive strategy.
    • And, finally, how to make the leap.

    That is the challenge, join me.

  • The twenty minuters

    … “Why are you called the Twenty Minuters”? Was Captain Darling’s question to Lord Flashheart in a Blackadder series.

    Major Bill March, a historian with the Royal Canadian Air Force, is quoted as saying of the early pilots “they used to call themselves the 20-Minute Club because the life expectancy of a new pilot in combat in 1916-17 was 20 minutes.”

    I understand that in the early part of the war pilots were being sent into combat with less that 9 hours flying time – basically, they knew how to take-off. But of course, we all know that there is a lot more to it than that, being able to land is probably optimistic, but useful if the need presented itself.

    In financial trading, many strategies in price action trading are sold through seminar attendance, or online packages. But we are sold the equivalent of the take-off lesson only.

    And actually that is fine. To know how to apply such things as a morning star pattern (and its many siblings), maybe throw in a good understanding of trend (much more difficult than it sounds), the use of the important support and resistance including pivot points, round numbers, possibly fibonacci levels and moving averages, then we are ready for trading action.

    But only in none intra-day trades. Meaning daily or weekly bars only. If we stay with that we have a chance…sort off.

    The problem is that we encourage ourselves, and possibly by the seminar or online package, to dive into the intraday bars, the ‘exciting’ day-trading stuff.

    This, however, is very wrong. At this stage we are not (and maybe never will be) equipped to deal with lower time frame trades. We may get away with the 4-hour bar chart and, at a pinch, the 1-hour, but moving lower with the relatively limited knowledge and experience we have gained we risk joining the traders equivalent of the twenty minuters.

    I trade the lower charts and I wish someone had told me this those many years ago, it would have saved me a lot of money and frustration. There is an easier way than the one I chose: simply never come below reading daily bars (New York close, of course) until we’re ready.

    In financial trading we want to be like this chap, he looks like he knows how to land!

  • Don’t fiddle

    I’m sure there are few things that provide more frustration than that of financial trading. The need, that we often have, to make the price on a chart move in a desired direction. We try to move price by will alone. The same as when we see a golfer on the TV try to move the path of a ball after the swing with body language.

    We therefore commit, but constantly fiddle as we go. We do this in sports, we’ve done this in our professional lives – If we do this with our trades we don’t do so well.

    Maybe it’s because we consider price, and therefore the chart, to be predictable and considerate. But the chart is active through the cumulative input of lots of lives, (not true, it’s mostly computers but they’re programmed so stay with me) built-up from inputs from multiples of institutions, agencies and individuals, each making their own interpretation of the outcome of price, working from multiple time frames and criteria.

    Price is therefore without emotion, price does not care about our trade. Self pity about a failed trade is pointless, other than the valuable lesson it generally always provides.

    Moreover, price is a ‘zero sum game’, meaning that price will only move if enough institutions, agencies or individuals are on the other side of the trade to accept the alternative trade, which builds uncertainty.

    Therefore any plan for price that we have is going to seem, at some point or other, more often than not, floored; a pure fantasy. However, if we don’t trade to a strategy then we will be in and out of trades like a jack-in-the-box with small to medium losses that destroy our confidence, our resolve and our account quicker than we think possible.

    So, what is the answer? Well, maybe: clarity, boldness and acceptance help.

    Clarity is clarity of strategy, which means a way to trade that is so clear to us that we’re almost embarrassed to mention its simplicity. Anything more than that is too complicated and unclear to us that we will dither when we need to take a trade.

    Boldness is boldness in our commitment to a strategy. No questions asked. Commit to the risk and no half measures… like reducing (or much worse increasing) the stop position, or exiting before target without good reason.

    Acceptance is acceptance of change. We cannot win every trade. To try to do so clashes with clarity of strategy and boldness and the loop will quickly collapse. Acceptance in our strategy, acceptance that it works most of the time; or at least some of the time.

    And if we manage correctly (rather than fiddle) then that is enough to be profitable.

  • Slow Trader Fund Update

    I was keen on a 30% increase in the fund this year, and I still think we will do this. That sort of increase for a normal fund is very good, if done consistently it can be outstanding, but I’m after achieving a lot more. I also want control of risk.

    When I trade longer term charts I do very well for a while then get hit unexpectedly. It is this uncertainty that prevents me from investing in the traditional sense.

    My passion is day trading. This has come about only over the last 3 years or so. Previously I used a similar trading strategy but with different time frames. The Slow Trader Fund would be traded say from the daily or 4-hour charts, meaning a trade would be held for several days or weeks, and I would concurrently day-trade a small amount of personal money.

    This has changed in that I’m shy of holding money over longer periods in a trade. I’m much more comfortable watching a trade, and be in and out again several times in the day, and never holding overnight.

    The reason that I’m now doing this is that I like to be in control. Particularly if I’ve been given responsibility for other people’s money. To say that I’m day-trading, rather than using a sensible medium term investment strategy, because of my consideration to risk, is barmy to traditional investors. Because they’ve always understood that day-trading is risky.

    They are correct, ordinarily. But it’s like fishing with a rod and line from a boat or free diving with a spear gun. We are not going to survive the first dive if we jump in and are expected to hold our breath for several minutes. We’d be better off and more successful fishing from the boat. But to the conditioned free diver the ability to catch fish from a free dive is far more precise and consistent.

    Cynics would say ‘get a net’. But when the so-called ‘medium risk’ investors with a net hit a storm they can lose the lot. So when they think they’re medium risk they are actually not.

    The day-trader will trade small and often. In contrast, for the medium-term trader the exposure is usually larger and over fewer trades. Rewards from day-trading can be exceptional. But it takes time to learn. This may have been gathered by regular readers of this blog. Like all things, I think worth the wait.

    However, I appreciate that investors may have other ideas. As I’m moving the fund to 100% day-trading the funds are available for transfer at no notice. Well, one day’s notice.

    To a certain extent, I trade at an amount proportional to the fund. That is the intention. But my own competency is the principal measure. For all of this year I’ve traded small. However, the trade amount, when it moves, will increase substantially.

    For instance, risk per trade has recently moved from a few pounds to £150 per trade, and will very soon be £300 per trade. The next step after that is to £600 per trade, where it will stay for some considerable time. I will take half a dozen or more trades per day. Moreover, I will trade twice within the same risk where appropriate.

    If we’ve mastered the day-trade then the potential is clear.

  • What I expect from a chart

    I’m often asked, with reference to my ‘fighter pilot’ days, if I ever miss it? Meaning, do I miss the flying. Mostly I don’t, and the person asking the question seems surprised by my answer.

    That is because they didn’t ask the right question. Flying the aircraft, once learnt, is the easy bit. The operation, leading the 8-ship of fighters at ultra low-level through heavily defended areas to engage a target hundreds of miles away to within a margin of a few seconds, is the hard part.

    And, it is the operation that I miss. Okay, not true, I watched the Red Arrows perform at Holkham this week and lived the moment, briefly.

    Technical trading has similarities, albeit only two-dimensional. Familiarity with a chart, and a chart that does everything we want of it, is like flying an aircraft – when we can fly one we can have a confident go at flying anything. How to trade, develop and implement strategies is the operational equivalent.

    I lost some confidence in my usual chart and broker last week when I was unable to exit a trade after the price moved rapidly, fortunately in my favour. With high volatility occasionally a broker is unable to provide a desired exit price and leaves the trade open. This, however, was not that. I was simply locked-into the trade. In hindsight the initial clue that all was not right, was the breakdown in the representation of some of my charts that I monitor on a higher time-frame.

    Why, as I was in a favourable direction, was it a problem to be locked-into the trade? It is disconcerting, moreover, I had tried to exit with a scalp, and before the bar bounced, and then would have held a portion of the trade for a swing target. When I discovered that I was ‘locked-in’ my whole concentration was on getting out (completely) which I achieved some way up the bounce. This was for a profit but a good way short of the target potential.

    Because of this, several days were taken to revisit other brokers to find a stable platform that does everything I want. Time consuming, but a worthwhile exercise. As a day-trader on lower time-frame charts the following are important to me: (1) spread; (2) reliable, clear charts linked to the broker that provide on chart dealing – importantly on-chart ‘limit’ entries with the ability, on chart, to set target and stop positions (3) as well as a chart zoom capability, I like to be able to grab and move the collective bars so I can quickly view stop and target positions (4) and, finally, the only indicators I use are a 21 and 55 exponential moving average but I do like a couple of easy to apply tools namely: my GLEM and a rule. (My GLEM is a modification of a fibonacci retracement tool and the rule, preferably, has to have a mirroring capability).

    The above provides everything I need for me to happily trade within my strategies. Anything less is a compromise. I tried most brokers and charts and a great way to do this is to open a demo account, load the charts and try them out. I got to the stage of finding a possible contender and opened a live account. This account provided some great additions over and above. Such as: being able to part exit a trade (i.e. take some profit off without closing out the whole trade); bid/ask lines on the chart; and, the ability to simply change between single and multiple chart screen presentation.

    However, after much perseverance I came back to my original broker and charts. I made many fresh tweaks to my layout and technique that were generated from my doing the exercise.

    The best fighter I have personally flown would be the F-16. Okay, it’s a single engine fighter and if that engine misses a beat every now and then we could be in trouble, but (operationally) it still beat the socks off everything else – I now feel the same way about my original charts!

  • Trade by rules, not emotion and intuition

    Those of us that want to technically trade the financial markets for a living, or simply make a profit doing so, have undoubtedly invested a lot of time, money and emotional effort into the process.

    There are, however, certain aspects that, no matter what our chosen trading method, seem to be hurdles for us all.

    Trading, for example, is full of contradictions: we need to hold our winning trades, but we need to know when to take profits; we need to make a traders equation, but we need wide stops; and we need to wait for a clear signal, but the so-called clear signals often don’t work.

    A few trading conditions that I struggled with, and still do from time to time, include: not holding the trade all the way to target; entering on a whim of a signal, or worse no signal at all; and, my unfortunate favourite, trying to reverse a trade too early.

    The latter is probably the single reason most traders struggle. I have an example trade from yesterday where (this time) I correctly held the trade from the currency pairing USD/JPY.

    Firstly, I have to say that context is a big part of my trading strategy. When I show these snips we are not showing the overall context. That is: what price was doing leading up to the few bars we show on the chart. Five minute bars in this case. In this instance over the last two days the market had been in a steep descent, or bear trend.

    We can see that the market turned bullish and went long in what seems to be three pushes (marked on the chart). After three pushes the market often reverses. For me the market was always in long after the 1st push and I looked for opportunities to get long.

    At this point a novice trader, influenced by the prior two-day bear market, and not trading in the moment, would be entering short at the top of both push 1 and 2 hoping for a resumption of the bear.

    I exited my long at the blue arrow marked ‘a’. Choosing the exact exit from my long position was, of course, fortuitous. I thought, correctly this time, that price may reverse early and before price could hit the green channel line which I’ve drawn.

    However, price did not pull back as expected and at the yellow circle, which I’ve marked on the chart, I re-entered long. I exited that long, at a measured distance of the previous leg, for a reasonable additional profit. This turned out to be a ‘final flag’ long.

    Reading the chart correctly, with the whole chart available, always seems obvious. However, reading bar by bar in a live trade is another thing altogether.

    We are wary about entering long because of the steep bear trend on the higher time frame chart; and, to continue long when the bars are in the top right hand corner of our screen, provides its own psychological block.

    To trade, as in this example, is often counter intuitive. Whether we use price action, indicators or a combination of both we can only make a profit if we trade by (expert) rules and not by emotion and intuition.

  • Most important, but often ignored

    Probability is something we understand very clearly when it comes to sports, but it seems to be a concept that we struggle with as a trader.

    We realise (because it’s been mentioned a few times) that the difference between a trader and a gambler – if we where to picked one thing – is adding or not adding probability into the mix of reward and risk.

    Some sports lend themselves very well to the example of probability. Basketball, tennis and (particularly) golf come to mind. I mentioned basketball last week because the point scoring matches well the traders multiples of reward to risk.

    In basketball we can score 3 points from a shot taken from outside of the defenders area; 2 points from inside the area; and 1 point from a free shot, if the opponent commits a foul. As a trader we often look to achieve a minimum target that is 3, 2 and 1 times our actual risk. (I like this to be planned risk but it is actual risk that the traders equation depends).

    We could suggest that a basketball shot taken from outside the defenders area has a probability of success that is low (it’s a long way to throw it!); however, the risk is also low as the defending team have little chance of a quick, undefended, attack in reply.

    A 2-pointer attempt is medium in probability as the (6’7″) defenders are there with us in the shooting area. It is also medium in risk as it is a dynamic manoeuvre and often with the full commitment to the shot from most, if not all, of the team; a quick steal and counter attack is possible.

    A free shot is never available in trading, therefore, I’d equate the 1-point attempt, in basketball terms, to the lob up court to a teammate in the hope of a quick score. The risk of interception is high but the probability, if our own team member catches it, of scoring quickly is also high.

    All well and good, but where does this take us in financial traders terms? As a trader, and regardless of which timeframe of chart we trade, we’re all looking to take trades where the probability, reward and risk make good sense. To do otherwise is, as we’ve said, gambling.

    As an aside, as a trader we’re always participating in the basketball equivalent of the NBA championships because the trading professionals (institutions and the like) make up most of the opposition and in this ‘zero sum game’ they’re always-in.

    In our basketball match, if we lob the ball up court but we don’t have a team member to receive it we have given the ball away; if we take a 3 point shot at basket when we have no defenders between us and the basket we have merely reduced our probability for no good reason.

    Our judgement of probability in sports is generally very good – instinctively making a workable probabilistic assessment; but as a trader we often ignore this all important aspect.

    Technical trading is a financial ‘sport’ where we can only participate against the professional league. At that level we cannot get probability, reward and risk confused. To do so is the same as chucking the ball up court without a receiver.  As want-to-be traders however we seem to do this all the time (ignore probability) and wonder why we don’t win.

  • A three-pointer, bar by bar

    I played a lot of basketball as a young adult. A sport relatively new to the UK at the time, I consider it the one major factor that gave me the confidence to go on and achieve my career aspirations as a pilot.

    The shot on the left from sometime in the early 70s and the reunion (good to see there is little change!) last week.

    How to relate this to trading. Well, sometime in the 80s the basketball three-point rule was introduced. This is a lower probability shot taken from beyond the three-point line, a designated ark surrounding the basket.

    Thank goodness they introduced this, as our opposition last week were younger (obviously), fitter, bigger, stronger – we had little chance of getting near the basket for the more probable closer shot. However, our long-range (low probability) shots, and particularly from the little bald guy on the left, were excellent.

    The equivalent in trading is a trade taken at an inflection point, where the probability is low but the reward can be at least three-times the risk.

    Here’s an example: a bar by bar trade taken yesterday morning.

    (Before I do so, I must explain that due to the uncertain volatility to sterling from Brexit negotiations I’ve dedicated myself over the last couple of weeks to being familiar with the currency pairing USD/JPY. You may recall that previously I favoured GBP/JPY. The former has, in general, smaller bars, however, the spread is correspondingly small.)

    For a couple of days the chart has been in a broad trading range. From the higher timeframe chart (not shown) the upper channel of the range is higher than bar 1 marked on the chart. However, as the higher time frame chart is always in short it would not be unusual for a decrease in price at this point. From the close of bar 1 we only have a moment to decide. I enter the trade short.

    We are aware that the close of our entry bar has engulfed several of the previous bars and closed below the 20 bar exponential moving average. However, significantly the bar has not yet crossed a change in premise line (marked by the red arrow). In basketball terms, a weak two-pointer.

    The next bar (bar 2 on the chart) goes against us. It closed higher than previous closes but is still below the recent wick marked by the green arrow.

    Another bar higher, a close beyond the wick and the likelihood of at least another move higher (and probably up to the channel line of the higher time frame chart). We’re out of the money with this trade. But we’ve structured the trade so that we have a distant stop position.

    Price starts to show some bearishness again and after a slight pull back we set a limit order to short at the high of the previous bars which gets filled from the wick of bar 3. (A low probability three-point basketball shot!) We are now entered short twice – once at the close of bar 1 and again from the high of bar 3. (Our stop for both is at least a measured move above the last leg of bar 2 and its subsequent bars).

    Hurrah, we get our anticipated short which puts us back into the money with our initial entry and in good profit with our second entry. The doji at bar 4 puts uncertainty back into the mix, and I exit both trades.

    This was correct as the market then went long. The purists would say that bar 5 is a good probability long…..however, after a ‘three-point bounce off the ring and in manoeuvre’ I wait, stay flat and gather my thoughts.


  • A traders day of two halves

    Very sensibly, most traders will not trade lower time frame charts because of the effect many news announcements have, seemingly unpredictably, on price.

    Let me give an example by following me through a (common) recent day of trading.

    The day I have chosen has a good array of news announcements, many of which have no effect on price but one does – the announcement that the UK interest rate will remain unchanged at 0.25%.

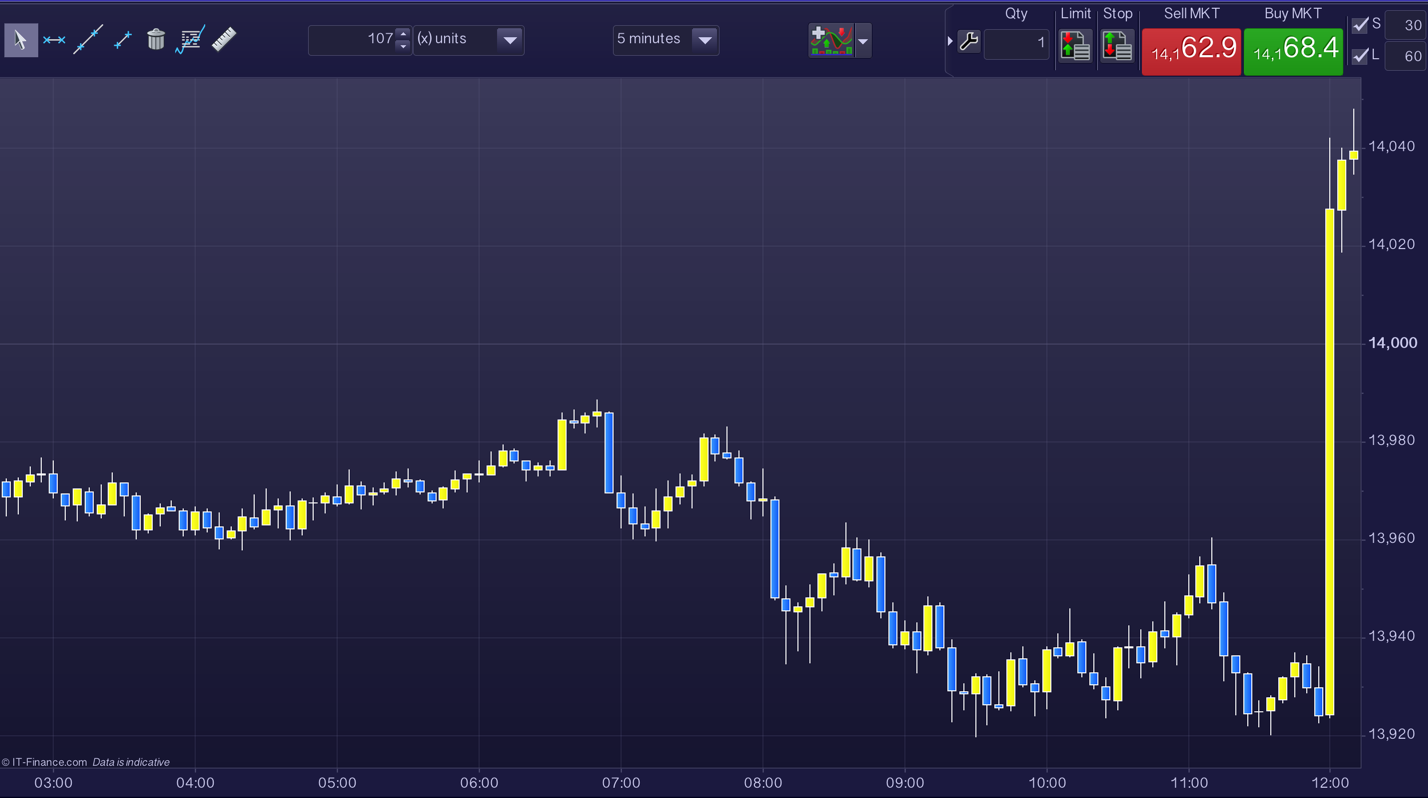
    At mid day, and within a few seconds of the (seemingly) unspectacular news, this happened to the chart:

    This is a chart of sterling to yen. The chart jumped just over 100 pips, which to a higher timeframe trader, say someone who trades using daily closed bars, and, as the chart will often move over 100 pips in a day, this is no big deal.

    To the lower time frame trader it is not the amount of the move but the little time that it took. That is what scares people away from short-term trading, and on the lower time frame chart this can happen a few times each week.

    However, through a combination of knowing when the news will be announced and (more importantly) reading the chart, we can be in the flow with price and very rarely risk being caught on the wrong side of such a price move. Conversely, because of risk, I’m rarely on the right side of such a large move either. That is not where I get my gains.

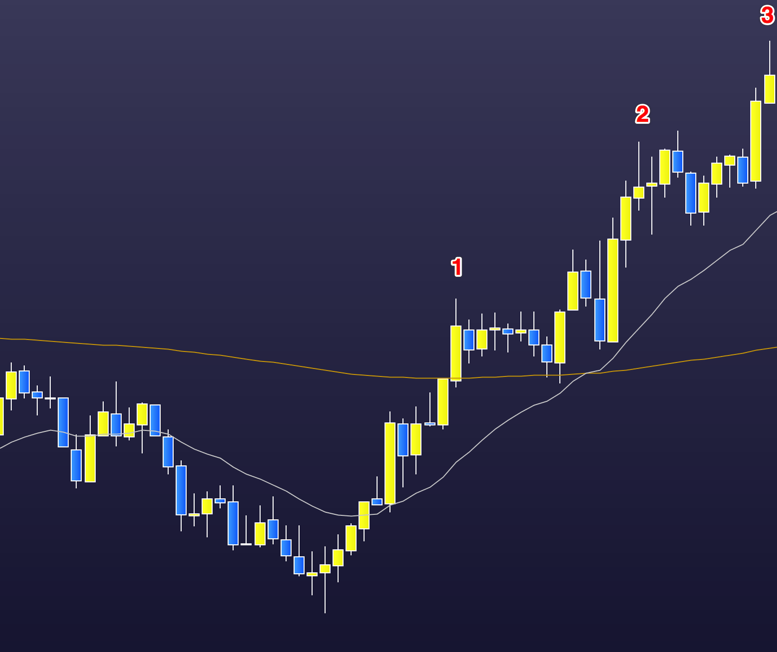
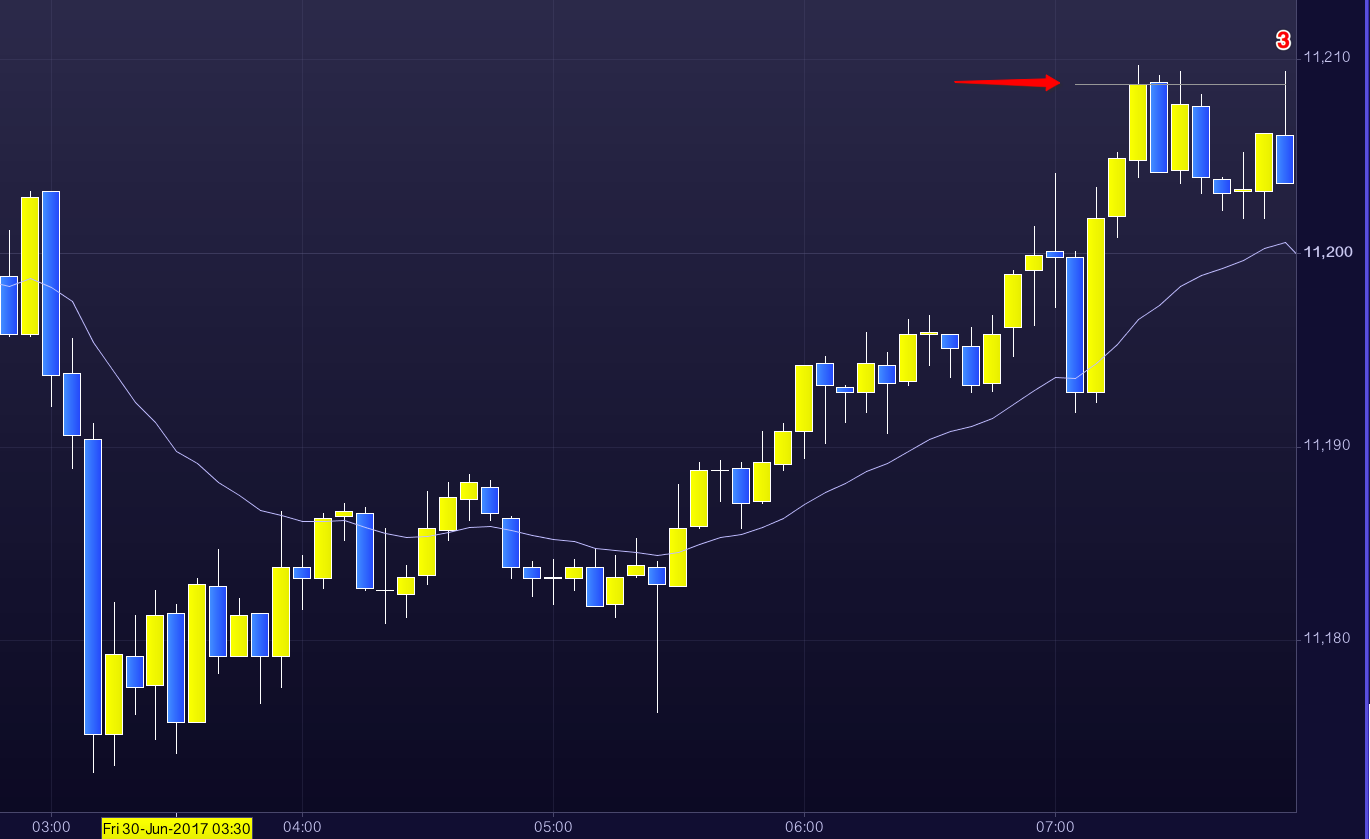
    Here’s the day per trade before that event.

    The chart always looks different prior to a big (relative to timeframe) move due to proportionality of the chart.

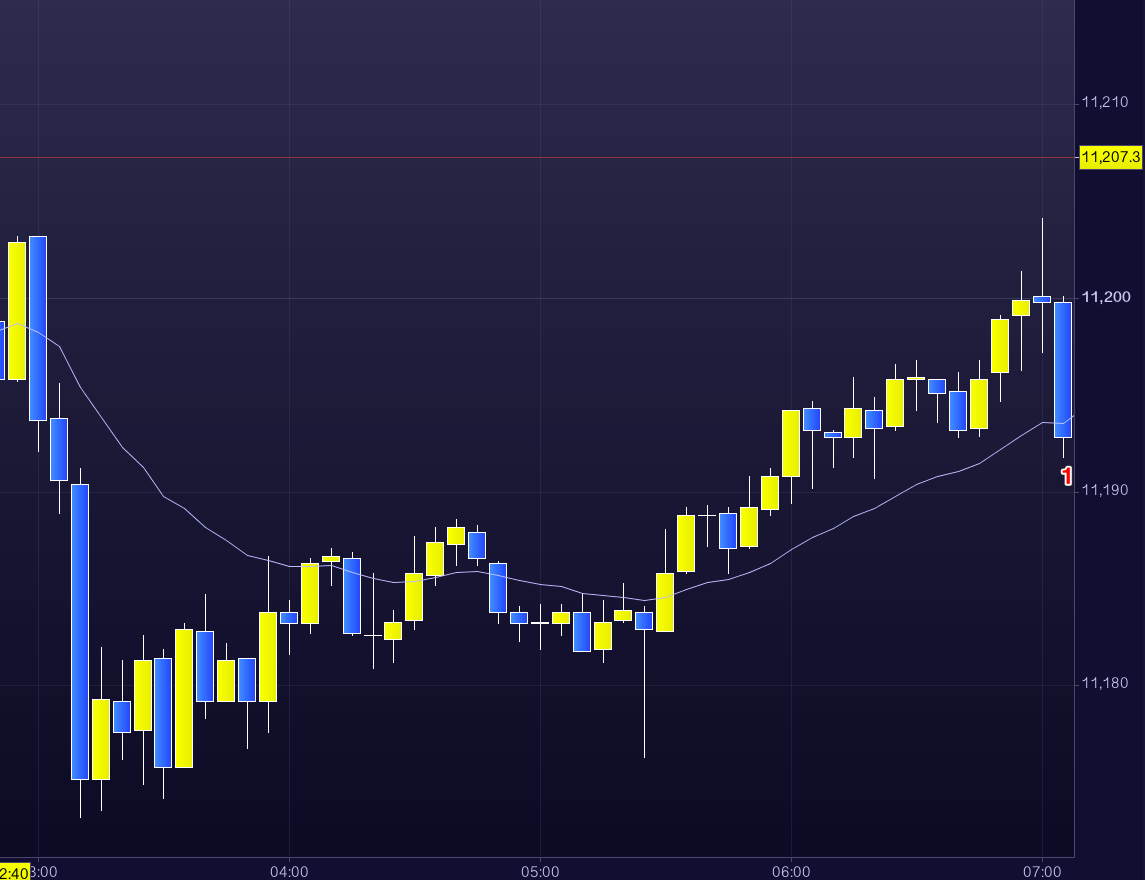
    My day started early, about 6am on the chart, concentrating on the one chart. Due to a combination of low bar size (price change) and high spread a start at 8am (UK time) is probably better, but there is nothing set.

    The close of bar number one was my first trade taken long. Not the best of trades as we have two small attempts to push up prior to bar one which ended up being a third and final, and possible exhaustion, push. A good out would have been the doji three bars later; however, I held and came out at a loss, but before my stop, as bar two crashed short.

    I entered the close of bar two short. Changing direction of trade is not the easiest of things for a trader to do; and because of this I only entered with one-third of my usual amount.

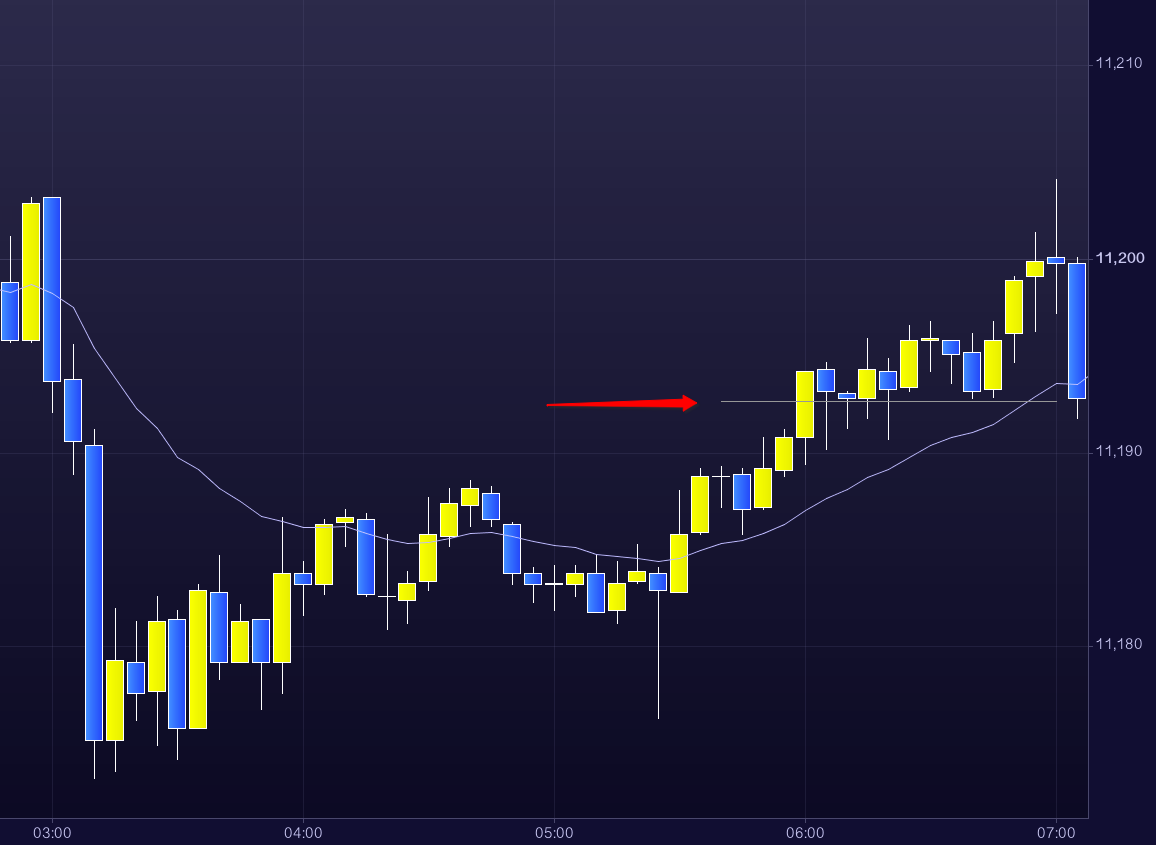
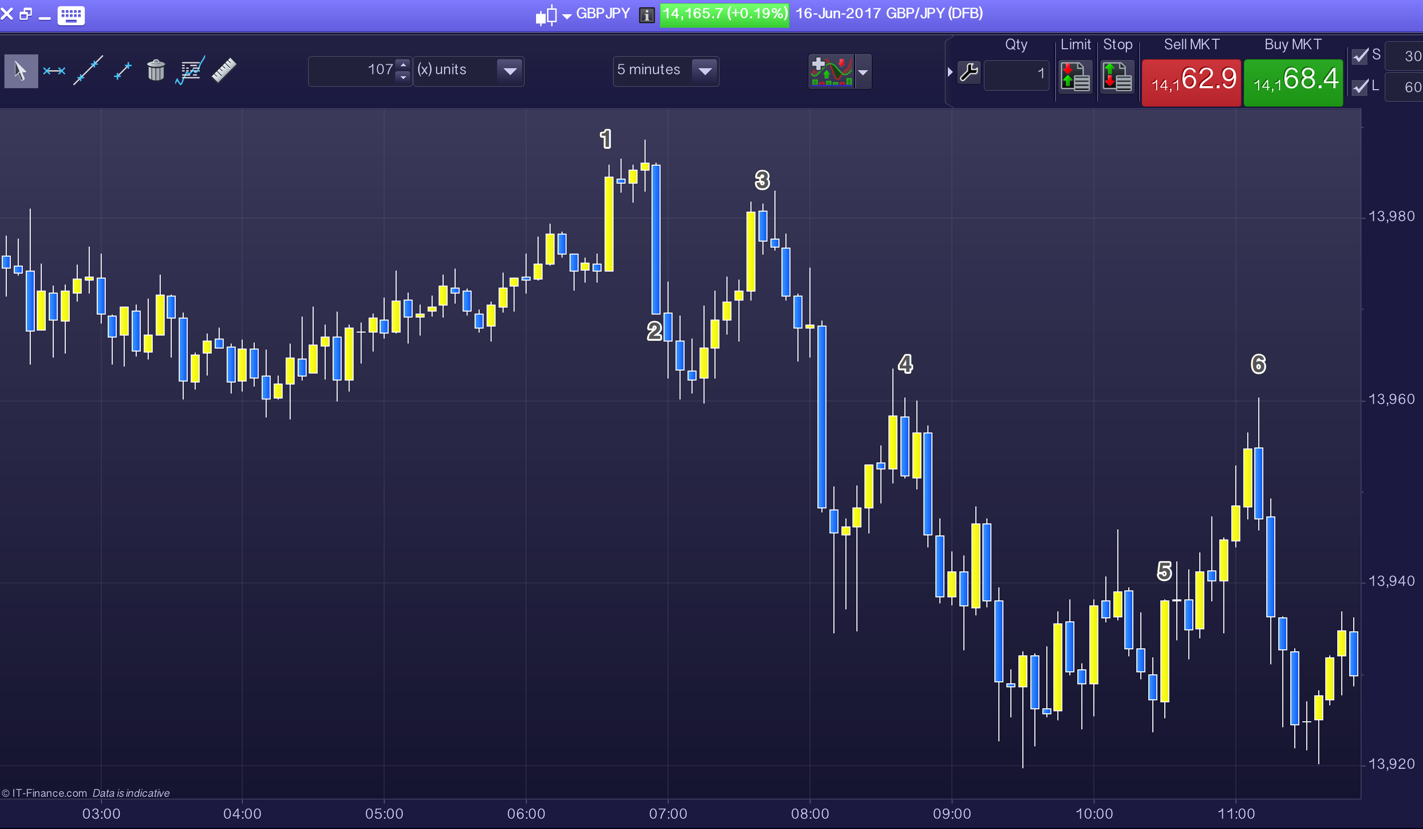
    I held that trade through the pull back. At the close of bar three I went short with the remaining two-thirds. I’m now fully committed short. The doji four bars later gave me pause for thought, but I held through until target which was a measured move to near the bottom of the next and large bar short.

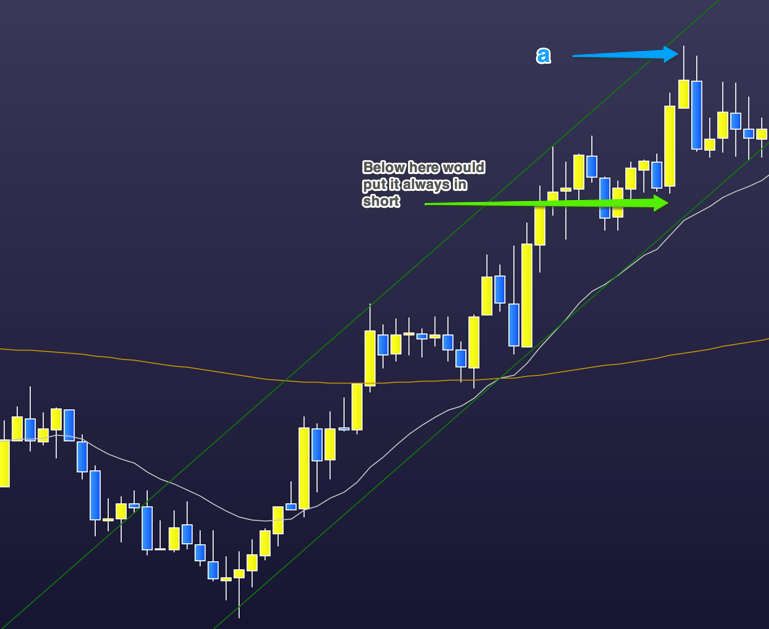
    Very good, we’re nicely in profit at this stage. The close of bar six was the next take short. This was an early take and I didn’t get my measure until the next but one bar and this provided another 18 pips of profit.

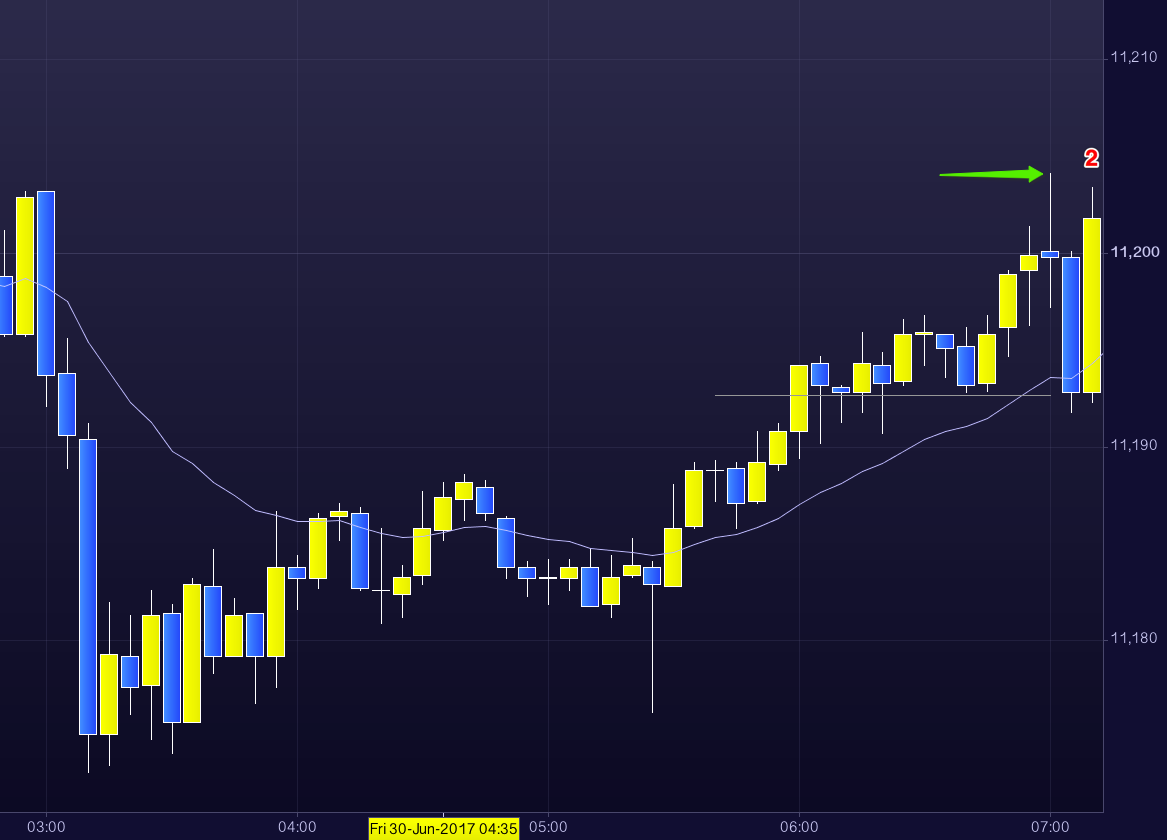
    Bar five, for me, provided a good probability long. So I entered long at the close of bar five. My target was 17 pips above. Excellent, that worked.

    Easily the most sure trade of the day was the close of bar six short. My target was below the low of the day, however, with the doji at the bottom of that leg, I exited the trade with 22 pips of profit. Moreover, the interest rate news announcement was imminent, so a great time to be flat.

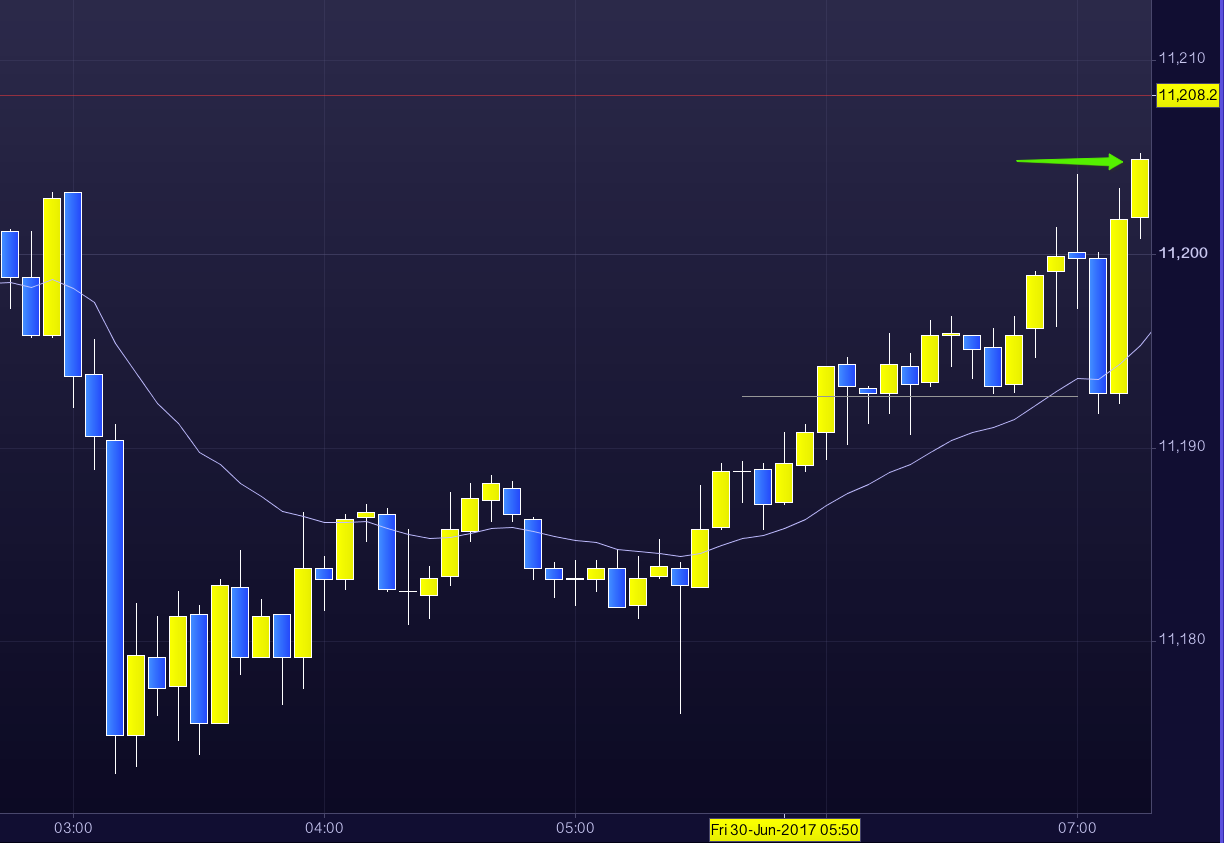
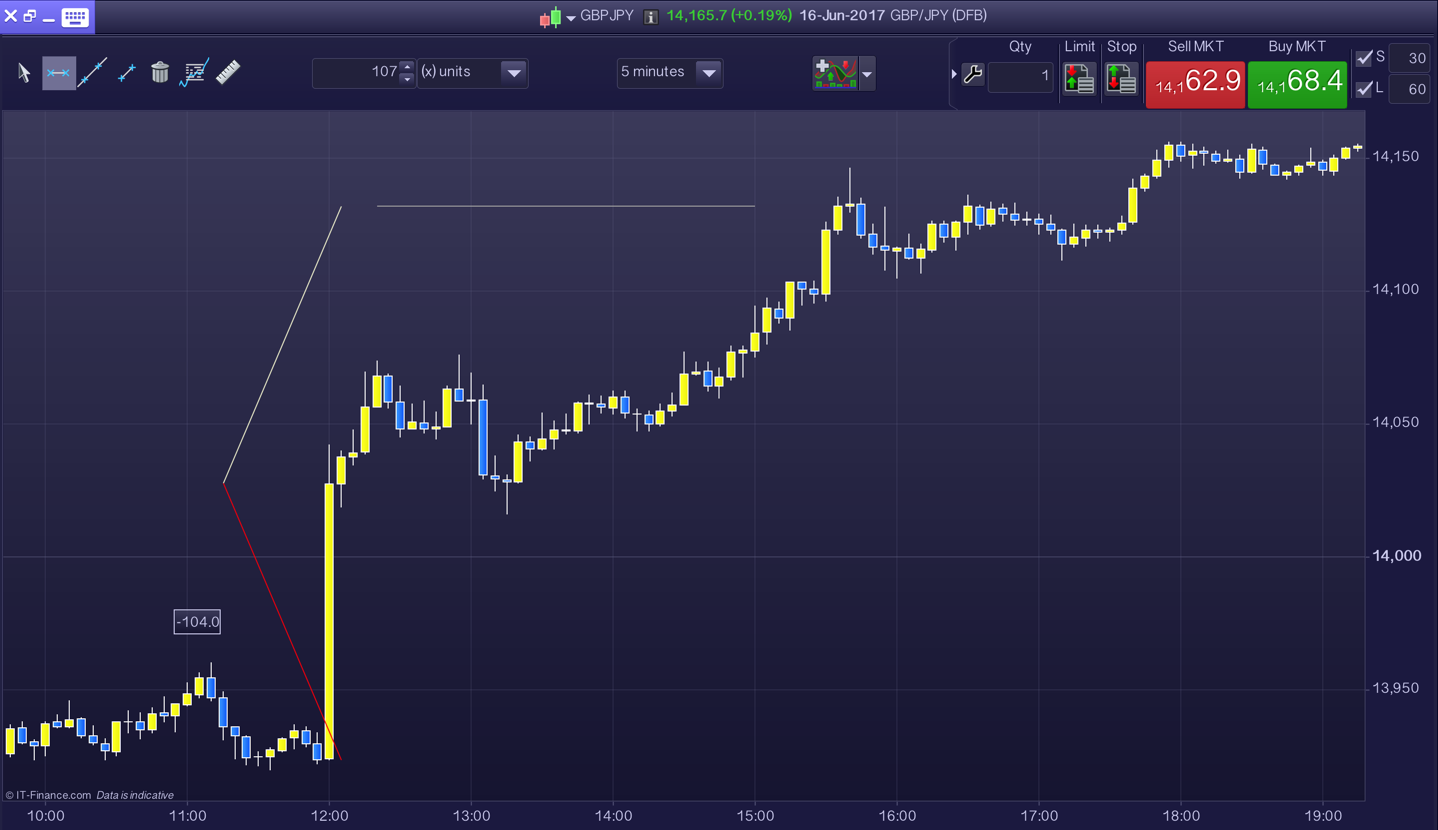
    After the news announcement and the rapid 100 pip bar long my strategy is to take the close of that bar long expecting another 100 pips. I didn’t as emotionally I was uncomfortable with the 100 pip risk. By early evening the move was completed.

    I’m pleased that after the news announcement, I then positively managed one swing and two further scalps, but amounting to significantly less than the subsequent 100 pips on offer for the afternoon. That is not disappointment on my part (an emotion that a trader has to ignore) but a reinforcement of my strategy, maybe for next time.

  • Trade without bias

    “No data yet!….It is a capital mistake to theorise before you have all the evidence, it biases the judgement.”                            Sherlock Holmes

    We’ve previously touched on an issue that: doctors, engineers, solicitors etc may have when they try to trade – and I was no exception.

    For a long time we have, through professional good habit, been comfortable predicting the way ahead based on our experience, good judgement and assumptions.

    In technical trading, however, such attributes do not help. Having a preconceived idea of what the market will do blinds us to reading the market in the moment. Or, as Arthur Conan Doyle wrote, “it biases the judgement”.

    We have previously considered (from Joshua Foer) that a grand master chess player does not look several moves ahead, as we all assume, but rather is coldly reacting, more or less, to the opposition pieces presented in that moment.

    A form of trading, which I like a lot, is what I call “always in” trading. This is best done on a single market and timeframe. Always-in provides the dual meaning of direction of trade and committing to a trade direction wherever possible.

    Whenever we are confident of an always-in trade direction, then we are to do everything we can to enter the trade.

    In a neutral, or 50/50, event the trader waits. But as soon as the always-in is defined with some probability then the trader enters the trade.

    Okay, there is more to it than that and why ‘always-in’ is a method, I think, for the experienced trader only – but bizarrely all beginners seem to start out with this or a similar methodology.

    To do the same in my previous career, it would be like joining the Red Arrows before completing flying training.


  • A chart mix

    My mother missed her step coming off a pavement and fell and broke her hip. She is doing remarkably well and I look forward next week to getting back to my trading, I’m a couple of weeks behind.

    Trading GBP/JPY on the 5 minute charts works well for me. I like the size of this market and on many days GBP/JPY can be quite defined. Anyone familiar with EUR/USD or even GBP/USD will find GBP/JPY quite lively.

    Many that trade major pairings will not take the spread into consideration, a mistake I think, but not a big one. Particularly if they trade from 15 minute charts or higher. GBP/JPY however, on a lower time frame, teaches us the necessity to consider the spread. To do otherwise, and be consistently profitable, is more difficult – I think.

    To make the best of both possibilities I’m happy with my results of concurrently trading GBP/JPY on the 5 minutes chart (as the priority chart) with a watch on USD/CAD, Gold and EUR/USD – each of which are on the 15 minute chart. I tried many possibilities but these choices give me good opportunity, diversity, liquidity and a spread value that I prefer.

    For example, GBP/JPY does not work with GBP/USD as both react almost in unison. Moreover, oil is often a mirror image of USD/CAD: so to trade one would have too much influence on the other. I do find that Gold and EUR/USD often have similar movements and on such days I consider a swap to AUD/USD or (and I’m in the early stages of this) the US 500 SPTRD.

    Other FX pairings, and particularly exotics, are not considerations for me. Primarily due to spread but also we are dealing with randomness and probability, and we don’t need big uncertainty too. As already mentioned, I’ve looked carefully at the US 500 SPTRD and this is a possibility on the 15 minute chart with good liquidity once the US market has opened.

    To trade the fund on the 4-hour charts is not possible (for me anyway) with already four intraday charts to manage. If my results are what I know they can be (and so far so good) over the next few weeks I will consider how to join the slow trader fund within this – more intensive – methodology.

  • The stabilisers have to come off, eventually

    Who takes up retail financial market trading? I initially imagined that it would be young adults, the ones we see on the sports betting adverts, but I was wrong. It’s primarily professional people: engineers, doctors, dentists, lawyers and well-to-do retirees. But unlike our usual work, we struggle to be successful at financial trading.

    Because, unlike our usual work, we are now dealing with uncertainty; and in this world, because we don’t understand the future, it is not possible to work rationally. To overcome this we look at the future by naive projection of the past.  We are now in a world where 60% certainty (if we’re very good) is as good as it gets. We therefore look to a method and indicators to help make what is irrational seem more rational.

    That brings me onto the decision of how to trade. The ‘how to’ question is probably one of the most difficult and important decisions a financial trader makes. However, as with choosing a career when we’re young, we do not have the experience to be sure we are making the right choice. Therefore, we are overly influenced by those around us.

    In trading we tend to go with the method that we learnt from the first seminar we attend. We try that to the point of financial exhaustion and either quit, or if we’re particularly determined, we will venture to try another seminar and another method. And so the cycle continues until we achieve expert or get lost in the ‘dip’ somewhere.

    With a little thought it does not need to be so difficult. We first need to find the broad category of trading method that suits us. If we stay away from the ‘get rich quick’ merchants (those advertising the secret or ‘the one thing’) then there are a lot of excellent tutors available.

    We do need to find that broad category first however: no point in learning chess when what we really enjoy is the simpler pace of draughts (checkers). Once we have that broad method that we determine is the one for us, we can then go to work on the finer detail.

    It took me a long time to find ‘price action’ as my prefered trading method. I notice also, looking through the internet, at great beginner introductions to price action that are available. Many however provide confluence ideas of price action with indicators: moving averages, Fibonacci retracement, stochastic overbought and oversold to mention a few.

    That’s fine, we all start with all of these; they’re supports and we feel, and were told, we would be foolish to attempt to trade without them. However, price action is much more than this (or I should say much less because with true price action indicators are a distraction at best). Once price action is learnt we can deal very well with the irrationality of it all and we can strip away the supports. After all, even Bradley Wiggins, probably earlier than most, had to take the stabilisers off at some point.