An early diary entry as I’m going away for a few days to where there is no internet and probably no mobile signal.
Lets take a look at short term swings.
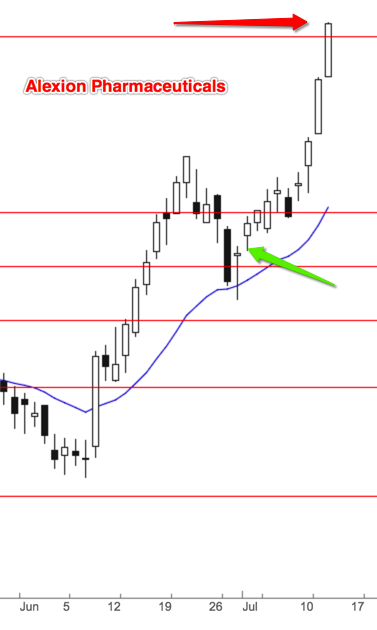
We mentioned Alexion Pharmaceuticals in the last blog. The green arrow represents the buy point. This is because the share price has pulled back, in this case to a 50% retrace of a previous move, and provided a buy signal – the pin pointing down is a clear buy signal.
The red arrow represents my sell point. The horizontal lines are drawn using the fibonacci retracement tool provided with most software and were drawn weeks before. This does not mean we can look into the future with share price but if certain things happen it does give us an advantage in determining probability.
The catch is if you miss the move – which I did being too concerned about Greece – then there are signals that allow you to get into the swing once it has started. But another concern is the index, in this case the S&P 500 index.
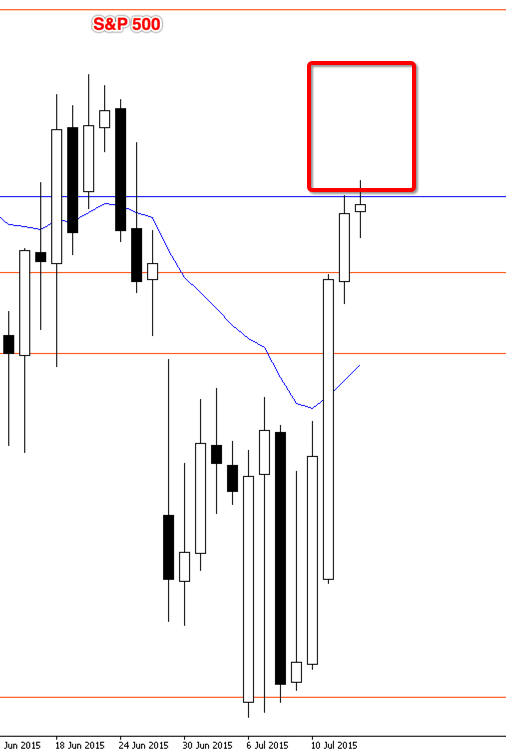
The index is of course an average price of all the stocks within the index. Some stocks being much larger than others means that the price change to individual stocks is not well defined but its a handy guide. If the index goes up, by definition, many of the stocks go up – and vice versa.
There is a good probability that the S&P index will bounce down when price reaches somewhere within the red box. Not long therefore. So to take a buy now from one of our stocks would be the wrong time for a short term swing trader. Or any trader. Better to be patient and wait for the index to swing back down again and provide a more profitable entry point.
I don’t use the index as a buy/sell signal, the individual stocks do that for us. Price swings are a factor in all charts to some extent: be it stocks, shares, FX or commodities. Reading those swings is the art.

Leave a comment