Tag: scalp

  • Downside, like Steve Jobs

    Let us chat strategy for a moment. Wikipedia says strategy “is a high level plan to achieve one or more goals under conditions of uncertainty.”

    Many that provide trading strategies have it wrong. What they are actually providing is a way to trade, or a  method, or a system. The way that I trade is contained within my ‘algorithm to trade by’ page and this is something I tinker with all the time. (I call it an algorithm so that I keep in mind that I’m up against algo-trading which is unemotional, timely and precise).

    What I don’t tinker with, however, is my strategy; well, at least not without a great deal of consideration. A strategy is to be clear:

    • Multiple swing
    • Swing
    • Swing/scalp
    • scalp

    (traders interpret a swing and a scalp differently, see ‘algorithms to trade by’ in the paragraph clarification)

    I may use a multiple swing strategy for very long-term value investing such as with Nick’s top FTSE 350 shares; a swing only strategy is perfect for intermediate traders or experts not intraday or unable to watch the trade; swing/scalp (my passion) is the full-time experts choice; and scalp only is, well, a difficult strategy because of the often poor reward/risk ratio.

    As I’m a swing/scalp strategist I also sub-divide that strategy into swing/scalp or scalp/swing; taking the first more determinedly than the second, but that’s for another time.

    Each strategy requires little understanding, just rationality in comparing two outcomes (price up, price down), exercising the better option and holding for the desired target. I get out at break even if my algorithm tells me to. It’s about control of the downside and then about the maximisation of the upside.

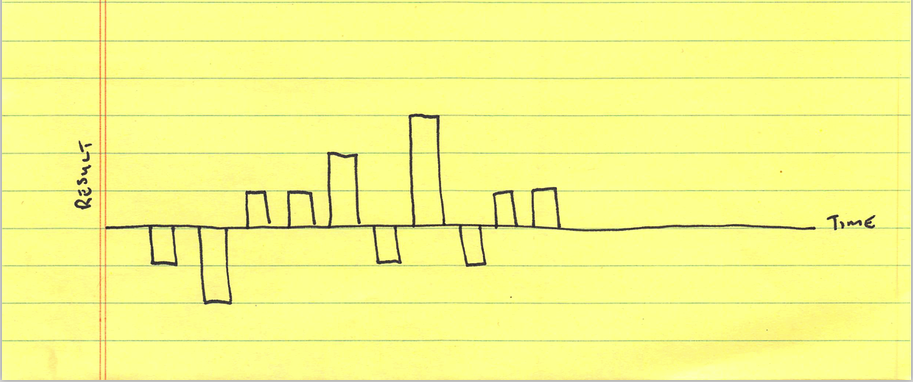
    The first sketch below was used by Steve Jobs at one of his presentations to show how he took (many) minimal downsides before he eventually got the big upside.

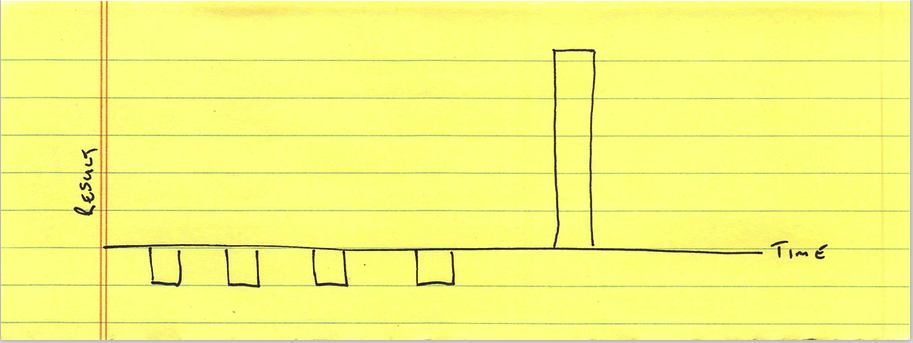
    The same is for good trading. The next sketch might represent how much was made or lost each year with a longer term investment. If we checked the results, say, every three years we would only once see a decrease in our year on year portfolio results, therefore minimising emotional drain.  Each blue horizontal line might represent a £1,000 (or multiples of) year on year profit or loss.

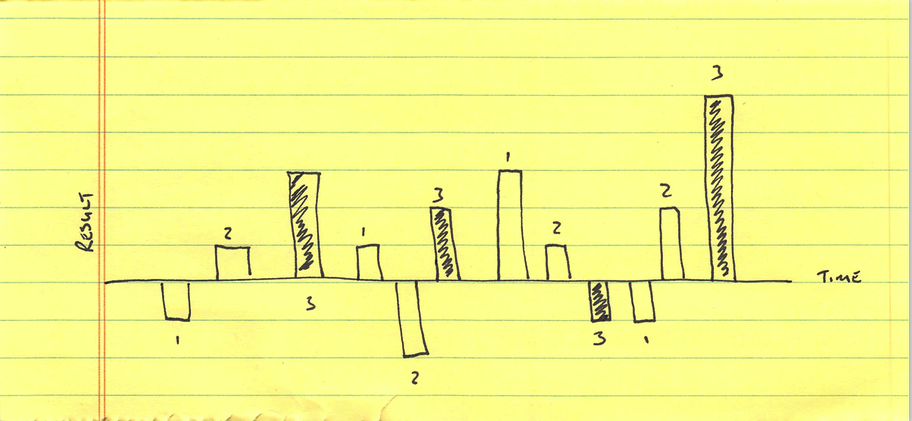
    Finally, a sketch of a day traders result for the day. A single blue horizontal line up or down represents a scalp win or loss; two horizontal lines is a swing. The bar with three horizontal bars up was a swing that was entered early and provided the extra profit. We should never see more than two bars at any one time to the downside. Each swing and scalp, therefore each horizontal blue bar, is the same in value whether the scalp was 10 pips or 30 pips. Each horizontal line represents the traders risk. A traders risk (each horizontal line) might be £60, or £600, or £6,000 – or any figure in between – depending on the traders account. But it has to be consistent.

    The point here is that any downside (for the sake of emotional drain and our pocket) has to be known, acceptable and controlled. This is something most of us don’t understand when we start out. Steve Jobs understood this and he did okay.

  • Weekly Diary – Slow Trader Fund 14th November 2015

    As the week progressed the trading opportunities in the 5-minute chart EUR USD went from frustration to good to ideal.

    As the week started good ‘scalp’ opportunities were taken within a tight trading range (shown by the thin red line below). However, on a final-buy (shown by the blue arrow below) I got it wrong; not with the trade, as this happens and I’m happy to take a small loss, but wrong because I left it too late to exit. This took away all that days good work, and a bit more. Frustration.

    Snip20151113_18

    Trading is such that I need to be 100%, or, sensibly, I don’t trade. The edge is too small to do otherwise.

    The middle of the week, shown below, was cautious but good with a few successful short sells and no losses: a short-sell is a trade that profits from the market price going down.

    Snip20151113_19

    The ideal trade came with a ‘swing’ trade at the end of the week.

    Snip20151113_20

    Late in the evening the EUR USD chart provided three pushes up, usually a sign of a final move, with the final move up being an exhaustion bar (a bar that is usually bigger than recent bars). This provided the high at the red box above. I took a short sell near the high with a buy back at the blue box. This more than made up for the error early in the week.

  • Weekly Diary – Slow Trader Fund

    Snip20151024_2

    Ashtead Group PLC (AHT) was a good buy for us, so far. The buy was at the bottom of a trading range, as we can see above. This has a 60% probability of climbing to, or near, the top of the range indicated by the target arrow. Of course, there is a 40% probability that the price will break higher from the trading range top. However, we have taken this for a ‘scalp’ rather than a ‘swing’. A swing would be where we would allow the price to retrace before going (hopefully) up higher. A scalp, on the other hand, is generally a movement from one extreme of a range to another without a retrace.

    Snip20151024_4

    The picture for crude oil, WTI, has changed slightly from my suggestion last week. The COT, shown above, only works with some degree of sureness when it is in harmony with the trend. The little turn up, that we can see at the very end of the blue chart line above, represents a downturn in the price. That tiny turn up represents about two weeks of price movement. I like to keep the COT on a 3-year chart as I find this best for perspective. COT, we may recall, is big picture stuff only. And, again, is only to be trusted when in unison with the trend. Which, in this case, it is not.

    Snip20151024_6

    Above, is the daily chart for crude oil. My own thought, is a move upwards soon, as indicated by the blue arrow, to provide a wide trading range. The price tried to turn upwards last week but failed. For another turn up we will need some price action confirmation supported by the COT.

    Other activities include an introduction of swing day trades on the FX market in EUR USD. In day trading I find it benefits greatly to concentrate on one market. I scalp and swing in my personal fond on day trades. Slow Trader, for the time being, will be swings only in day trading respects. Swings tend to be lower probability trades, about 40%, but have bigger reward potential. They are also less intense to scalps. We will see how this progresses for the fund and, of course, I will keep you posted.