Tag: EUR USD

  • Slow Trader Fund Update

    Slow Trader is now closed to any new funds until next year. Here are the amounts:

    Snip20160305_1

    For the sake of simplicity, percentage gain or loss refers to original funded amounts.

    We are now ready for 2016. Our attention this year is on gold, silver, copper and crude oil. We will also trade from time-to-time the SPDR S&P 500 ETF fund (all sessions) and currency: namely the Euro against the US dollar. We may trade the occasional stock.

    We have an excellent short signal developing for silver. That is, we consider silver will drop again in price. Signals for each of our commodities happen no more than a couple of times a year. Therefore, when we get them we need to take full advantage.

    The S&P and EUR/USD are not cyclical like the commodities – therefore we will trade these via lower time frame charts (one or four-hour chart and, occasionally, as low as the 15 minute chart).

    Commodities are traded through daily charts and in conjunction with the COT report.

    For those building funds for grand kids, or simply looking to buy the Aston Martin DB11 – then here we go!

  • Weekly Diary – Slow Trader Fund 28th November 2015

    Here’s a potential trade from the middle of this week that, for one reason or another, I did not take but one that I think illustrates the potential of Price Action Trading when done well:

    Snip20151128_26

    This is the EUR USD 5 minute chart for Wednesday 25th November. The red square was at 8 am (UK time). For the watchful this showed itself as a major trend reversal (MTR) or a lower double top. (There is nothing major about a MTR because in a higher time frame, say the daily chart, this is just a medium-sized doji bar of no spectacular context).

    However, on the 5 minute chart a good sell (or short) position was shown at position ‘A’. MTR’s, such as we have here, have a probability of about 40% in working. Therefore it is more than likely that we will lose our money. With this in mind, we need to manage our trade accordingly. That is, trade an amount that we can afford to lose. Placing a trade at ‘A’ we would have a stop (a position we will get out with a maximum loss) just above the highest bar. About 20 pips away. Lets say our maximum trade in this situation is £9 per pip, therefore we have a 60% chance of losing £180 – plus the spread so we’ll call it an even £200 risk.

    We have to be confident with our read of the charts. At position ‘B’ we are provided with an opportunity to add to our trade. If we do so we could place an additional £9 trade with our stop now for both the ‘A’ trade and the ‘B’ trade at the opening (original) position of our trade at ‘A’. That is: we have a break-even stop for our first trade and again about a £200 risk for our second, or ‘B’, trade.

    We then follow the same sequence of events at ‘C’ and possibly again at ‘D’. We would exit the whole lot at the blue circle. To be fair I would probably have managed the trade on the way down and exited some of my trade earlier, just below ‘C’. However, you probably get the message.

    Trading a MTR is only one of many strategies. A MTR is high risk, no better than a 40% chance of success, but the reward compared to the risk is high. In this case the reward was 4 to 1 for the initial trade. The potential return from this trade, if managed correctly, and with entries as I’ve suggested, was in the region of £1700. That is assuming that the trades were held all the way to the blue circle and that the trade at ‘D’ was exited at break even.

    Not a bad return for a mornings concentration.

  • Weekly Diary – Slow Trader Fund 14th November 2015

    As the week progressed the trading opportunities in the 5-minute chart EUR USD went from frustration to good to ideal.

    As the week started good ‘scalp’ opportunities were taken within a tight trading range (shown by the thin red line below). However, on a final-buy (shown by the blue arrow below) I got it wrong; not with the trade, as this happens and I’m happy to take a small loss, but wrong because I left it too late to exit. This took away all that days good work, and a bit more. Frustration.

    Snip20151113_18

    Trading is such that I need to be 100%, or, sensibly, I don’t trade. The edge is too small to do otherwise.

    The middle of the week, shown below, was cautious but good with a few successful short sells and no losses: a short-sell is a trade that profits from the market price going down.

    Snip20151113_19

    The ideal trade came with a ‘swing’ trade at the end of the week.

    Snip20151113_20

    Late in the evening the EUR USD chart provided three pushes up, usually a sign of a final move, with the final move up being an exhaustion bar (a bar that is usually bigger than recent bars). This provided the high at the red box above. I took a short sell near the high with a buy back at the blue box. This more than made up for the error early in the week.

  • How big is the FX market?

    Most of my trading time is currently in the Foreign Exchange (FX) market, so here’s a potted version of what it’s all about:

    The FX market is a decentralised global market for the trading of currencies. It is by far the largest market in the world with an average turnover of some USD$4 trillion per day.

    The main participants are the larger international banks.

    Snip20151111_17

    And, the largest Financial Centres for these institutions are London and New York.

    The FX market also comprises smaller banks, hedge funds, high frequency trading firms and the smaller trading firms/individual traders. Market share of all the smaller traders together is not more than 5% – but growing.

    Trading is around the clock. Thank goodness the market is closed at weekends.

    Most FX trading is speculative, that is the person or institution that bought the currency has no plan to take actual delivery of the currency; rather they were just speculating on the movement of that particular currency.

    The large majority of currency turnover (roughly three-quarters) involves the United States Dollar (USD), next (but a third of the size) is the Euro (EUR), then the Japanese Yen, Pound Sterling, and further down is the Australian Dollar, the Swiss Dollar and the Canadian Dollar. The remaining currencies have a very small representation when compared to the USD.

    As I currently trade the 5-minute charts, I prefer to trade just one currency pairing: and for me its the EUR USD.

  • Weekly Diary – Slow Trader Fund 7th November 2015

    I will provide the fund amount the first Saturday of each month, or close to it.

    We are 7% up on our original investment:

    Snip20151107_8

    The name Slow Trader refered to my trading style. Namely my steadiness in terms of: ‘the tortoise and the hare’. It was not intended to refer to the pace at which the fund will grow. I’ve moved from indicator based trading to raw charts and price action trading. This is definitely a trading style where the stabilisers have been taken off. And, as with that analogy, once we are comfortable without the stabilisers we can achieve so much more.

    I have been very cautious only trading with small amounts over many months. We have not missed opportunities because in price action trading there are several opportunities daily. What is important is that we learn how to read the charts with a high level of confidence. Moreover, we need to be able to manage our trades correctly varying our approach, depending, for example, on the trade scenario: trend (breakout or channel) or trading range, swing trade or scalp, scaling in or not, scaling out or not, and on each trade we need to consider a positive traders equation.. only to mention a few.

    The trading amount will build naturally. I wouldn’t like to say if it will take a couple of weeks or a couple of months. It will just happen at the right time. A professional price action trader to go from okay (that is if her fund survives the learning stages) to successful would take 3 to 7 years. I feel that this timeline has been reduced for us due to: my previous trading experience (I wasn’t going in cold to price action trading) my full-time dedication to the process (a luxury most traders starting out cannot do) and sharing my day-to-day learning with my son (James) where we have been able to bring each other along much more quickly than someone working alone would be able to do.

    Snip20151107_11

    Above is the 5 minute chart of the EUR USD from yesterday. As we can see, we took a buy at the blue arrow and sold at the green arrow. Actually, we scaled in and scaled out but the result overall is the same. We had done this eleven times over the last couple of days without a loss. However, what I’m about to show proves the need to maintain an overall awareness to what is happening in the market.

    Snip20151107_16

    The blue box above is the same chart information as the first chart. The reason it looks all squashed up is because of what happened a few minutes later: the announcement of the monthly nonfarm payroll in the USD. This large movement distorts the vertical (y-axis). I don’t trade these announcements. They are difficult to predict. Often moving significantly one way only to reverse. The S&P 500 weakened due to the announcement but in the chart above the US dollar strengthened. Also, short or long spreads (the spread is where a broker makes her profit) increases dramatically during these volatile moments. The bottom line is that it is essential to know about these events and if we don’t have a stratergy – stay out.

  • Weekly Diary – Slow Trader Fund

    A week of lessons and some missed trades.

    A few areas that I’ve traded this week have been disappointing. Not by judging the trade correctly, far from it, that has been good, but by being stopped out too soon. A novice trading error possibly. It’s a great lesson to take forward.

    Here are the trades in question:

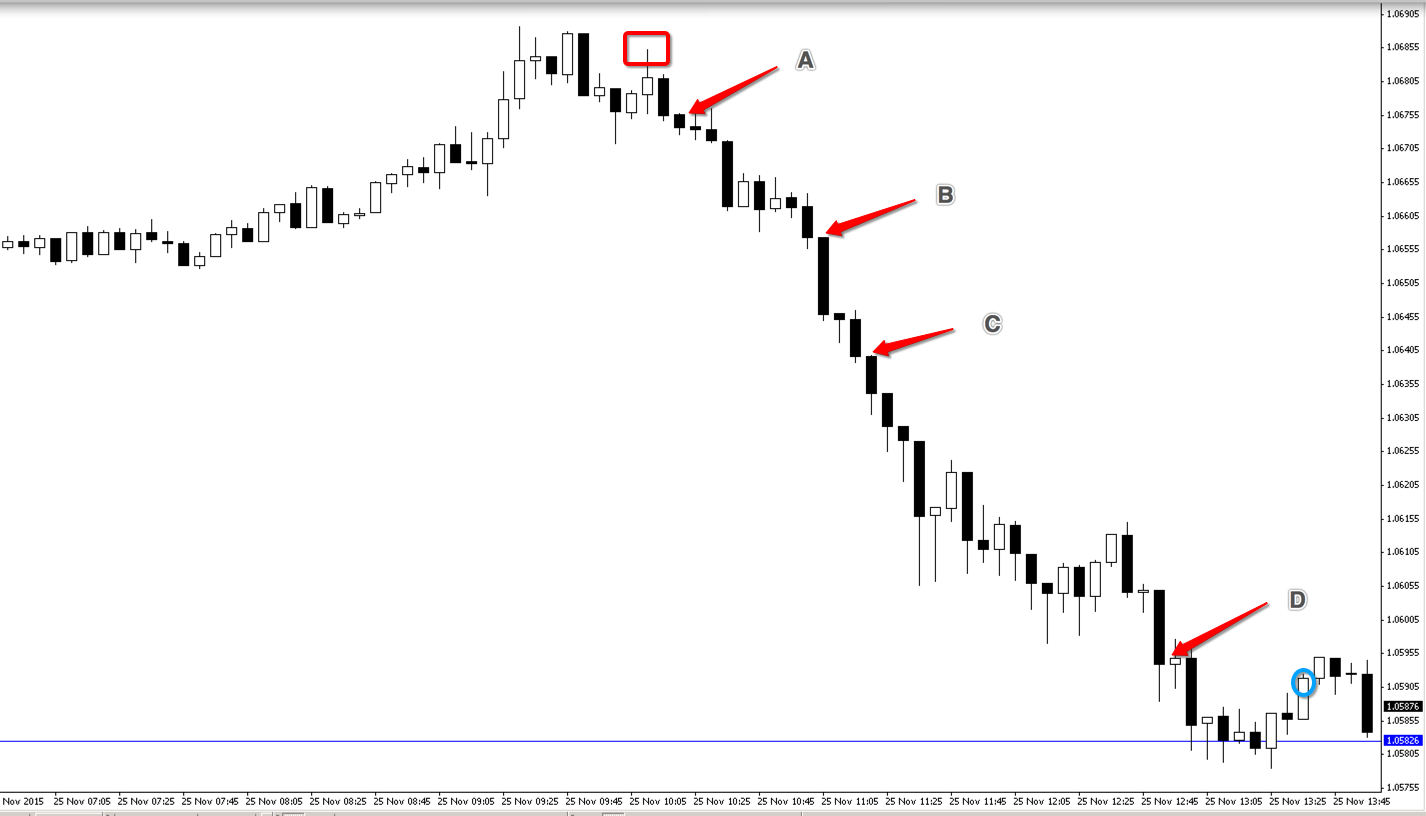
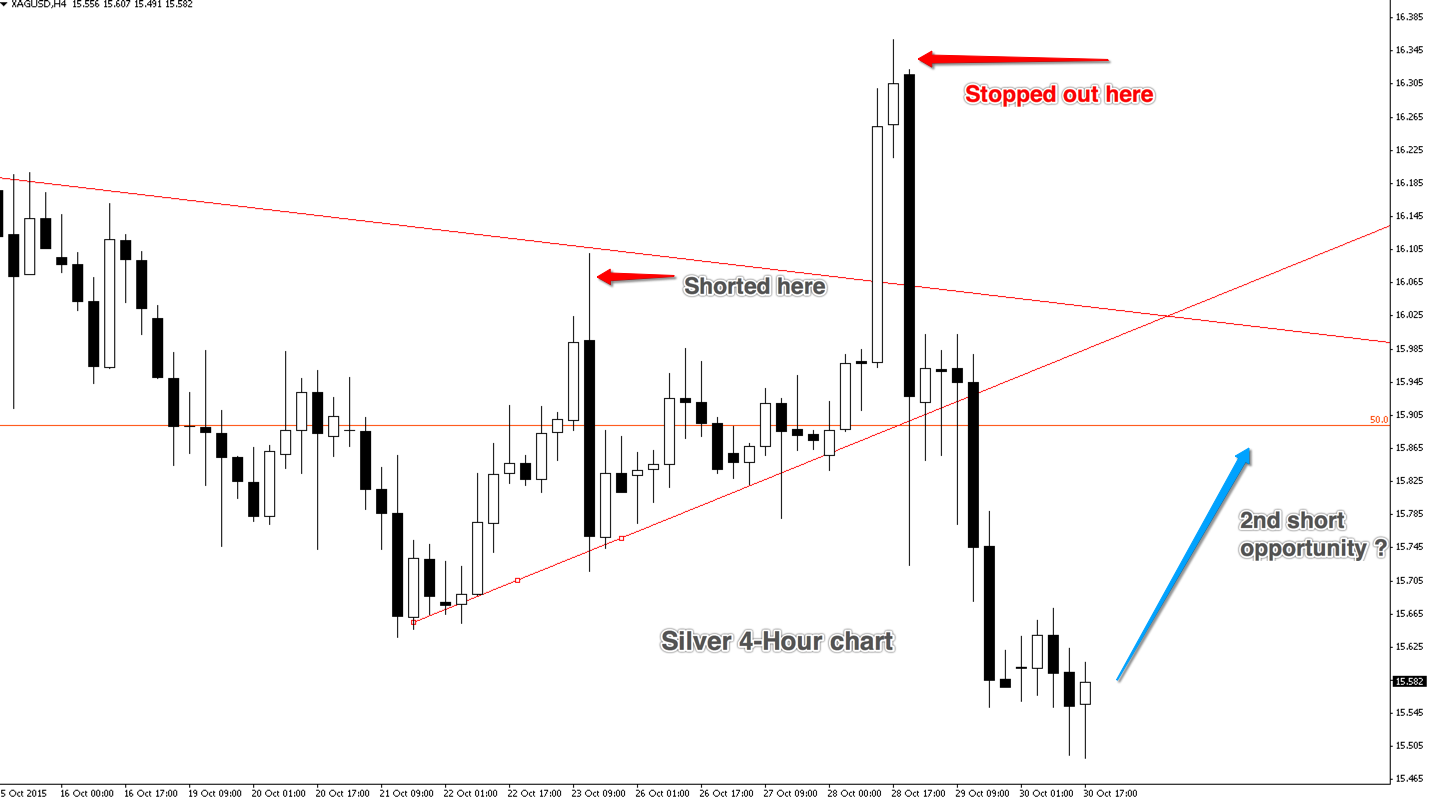
    Silver. We had a good ‘short’ signal for silver. Both on the chart and the COT. The COT was a little early, so I set what I considered to be a good size stop. A stop is the exit point, the point at which we get out and accept our loss if all goes wrong. Notice on the chart below how the price climbed to almost the exact position of my stop. A stop twice this distance with a reduced trade amount was the answer. We may have a second chance if price retraces as I’ve indicated with the blue arrow.

    Snip20151030_13

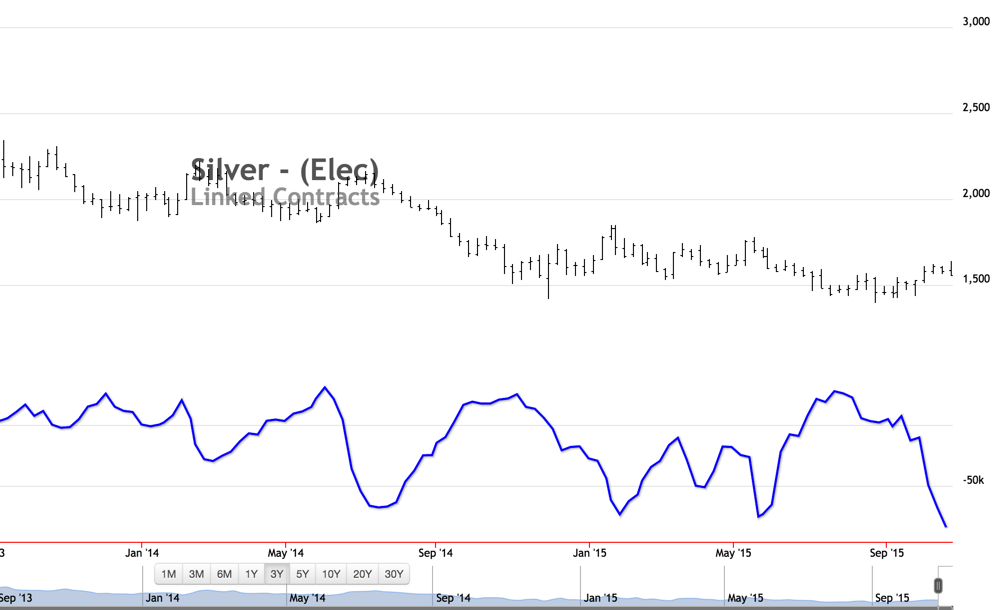
    Notice the COT below for silver. It is at a 3-year low shown by the blue line. Once this turns up, and remember that the COT is big picture only, this will support a short for silver. Gold has also come down with a similar, although not quite so pronounced, COT picture.

    Snip20151030_14

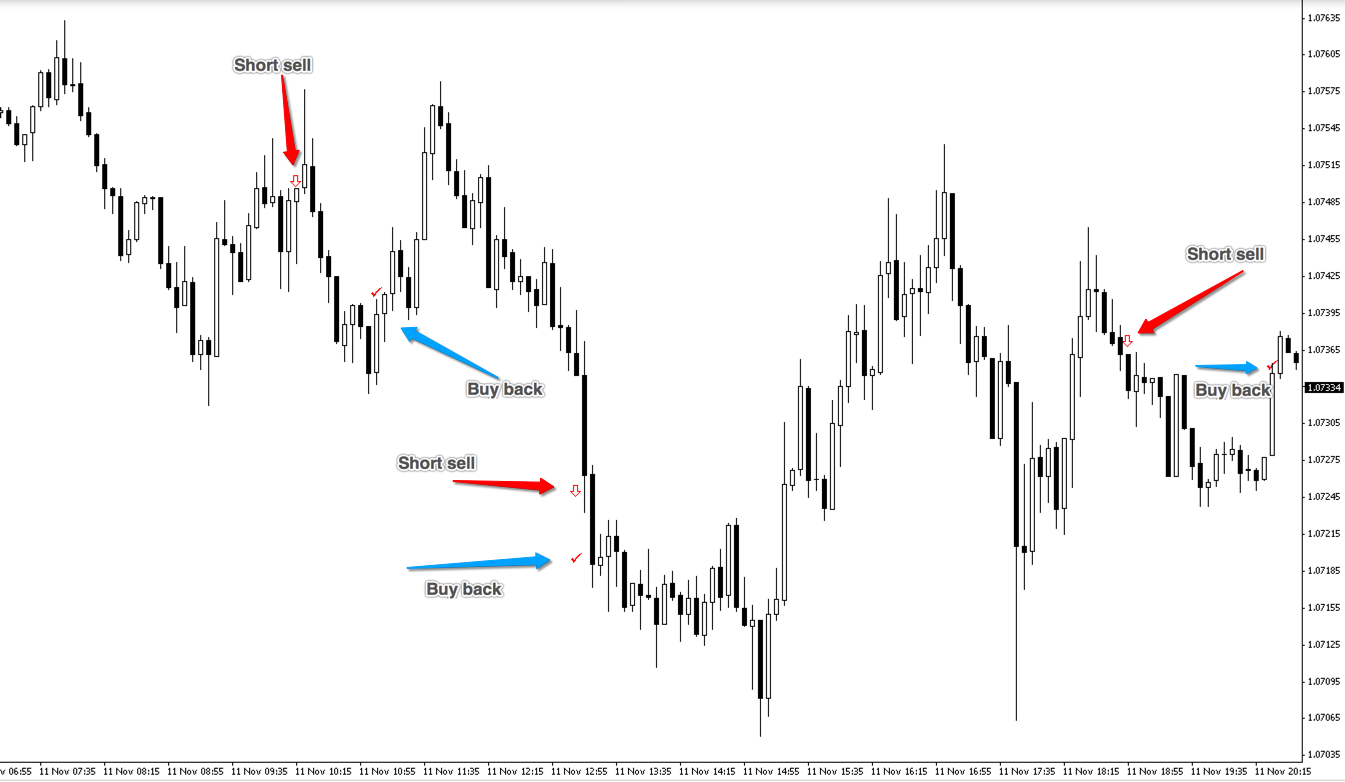
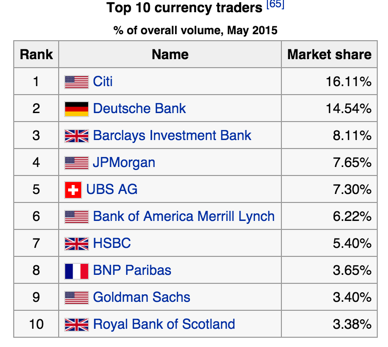
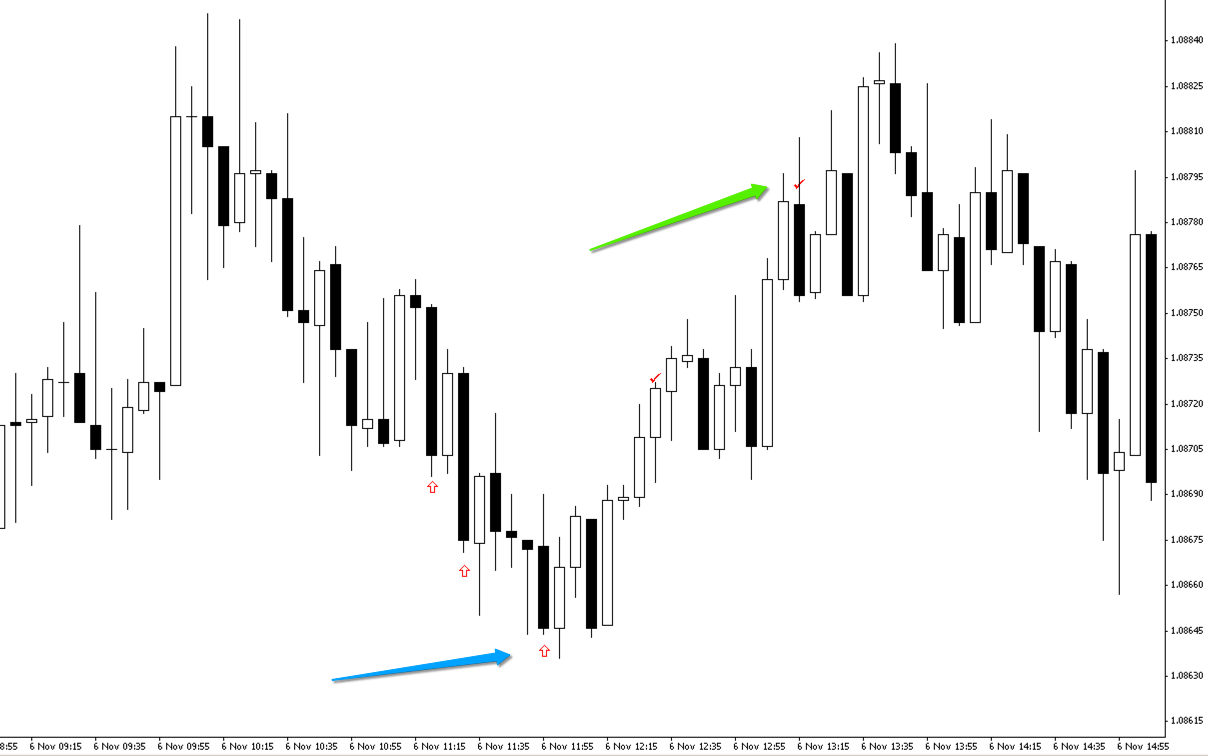
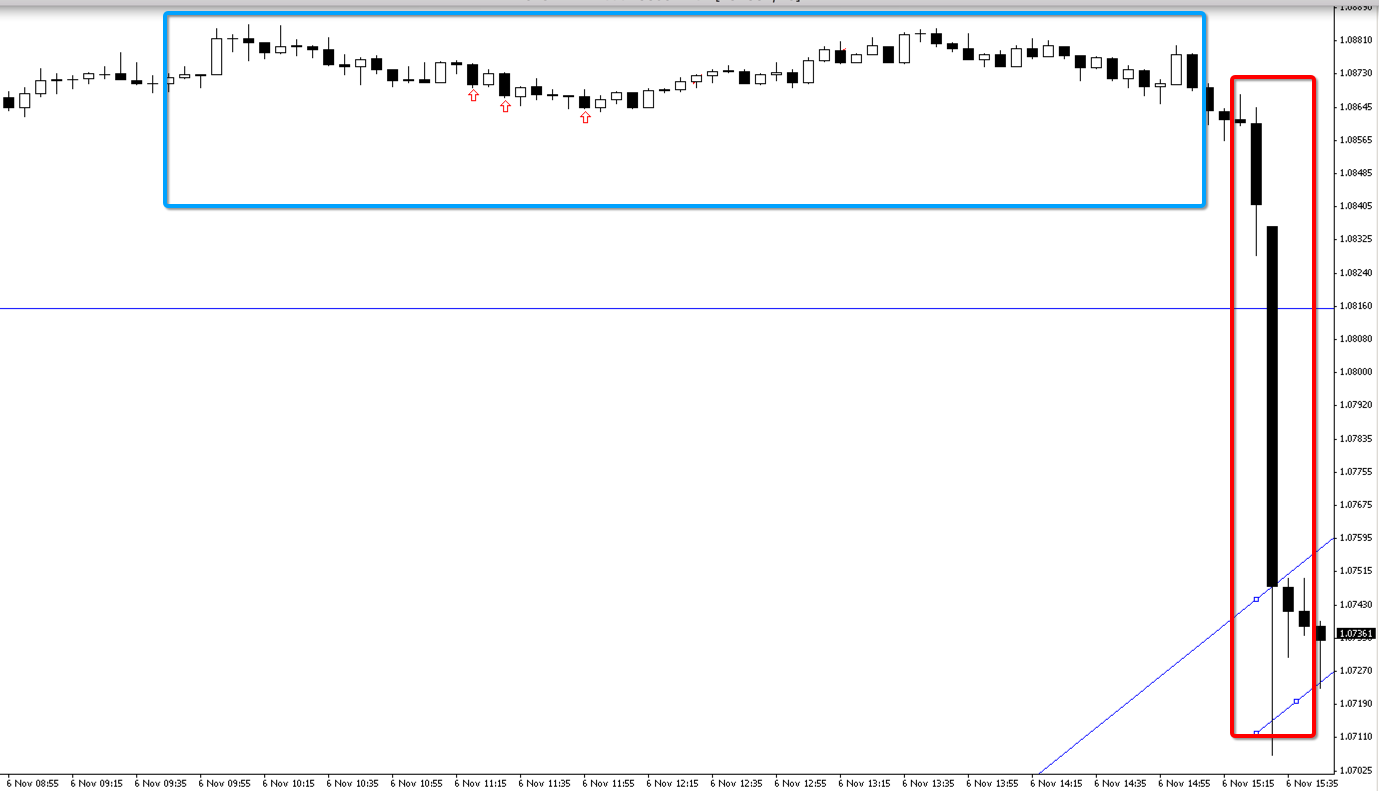
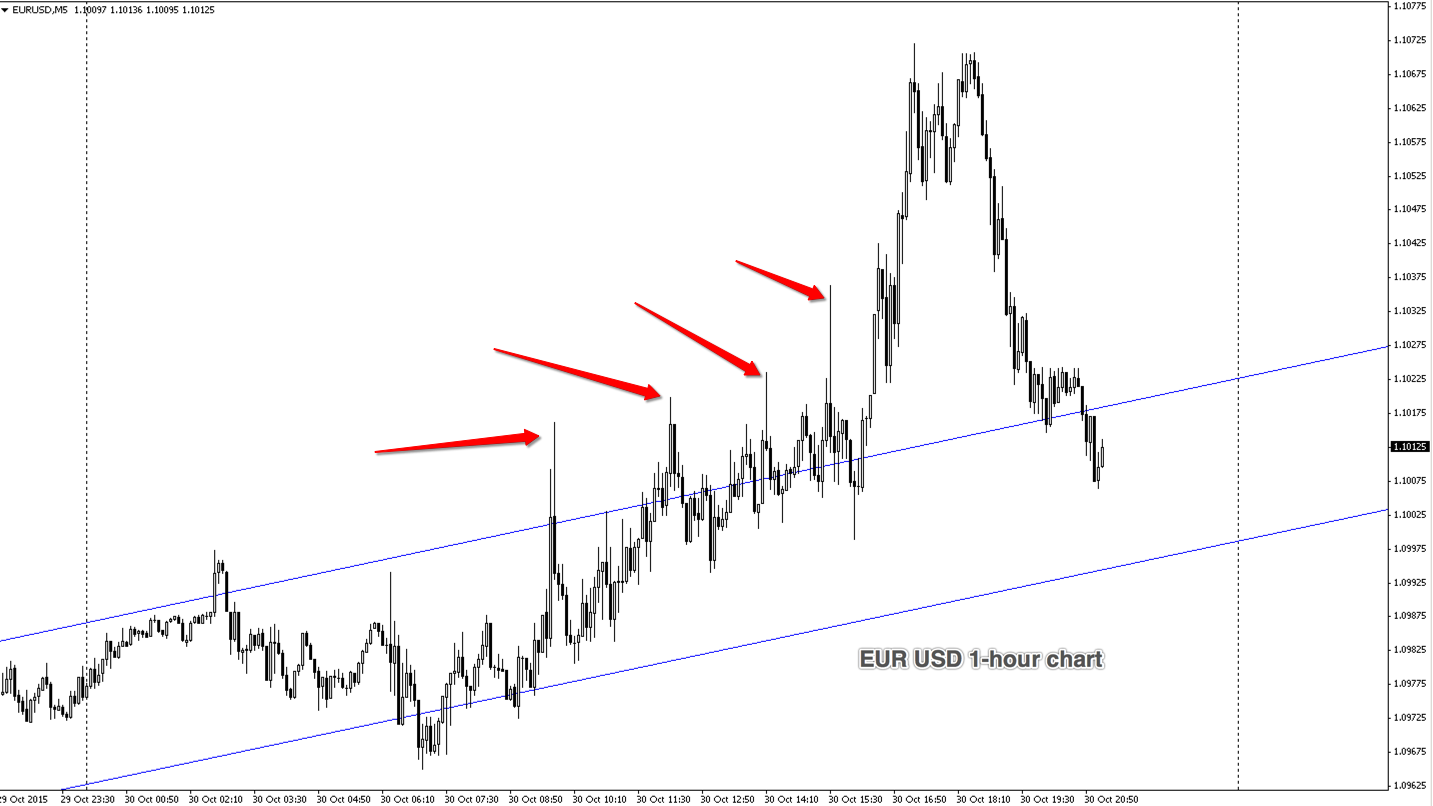
    EUR USD. The currency pairing of EUR USD is one that I trade day-to-day. Notice how volatile this currency has been of late. I have provided the 1-hour chart to illustrate this by showing several recent spikes up.

    Snip20151030_18

    The spikes may not look like much, but to a day trader (trading an intraday chart) they are a challenge. Again a significant stop distance (about 40 pips) is necessary. However, this makes for difficulty achieving a traders equation of 2:1 on a 40% probability trade, which is the minimum requirement for most swing trades.

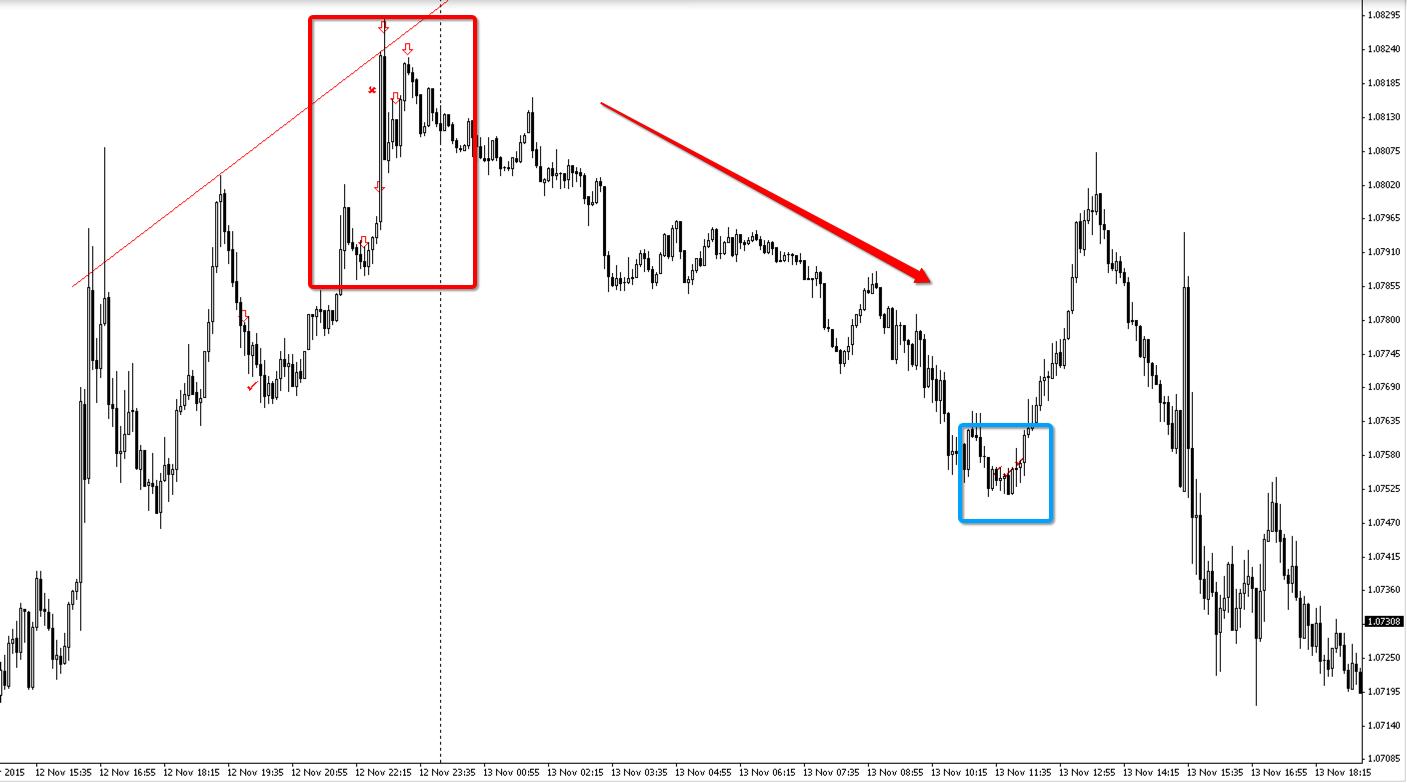
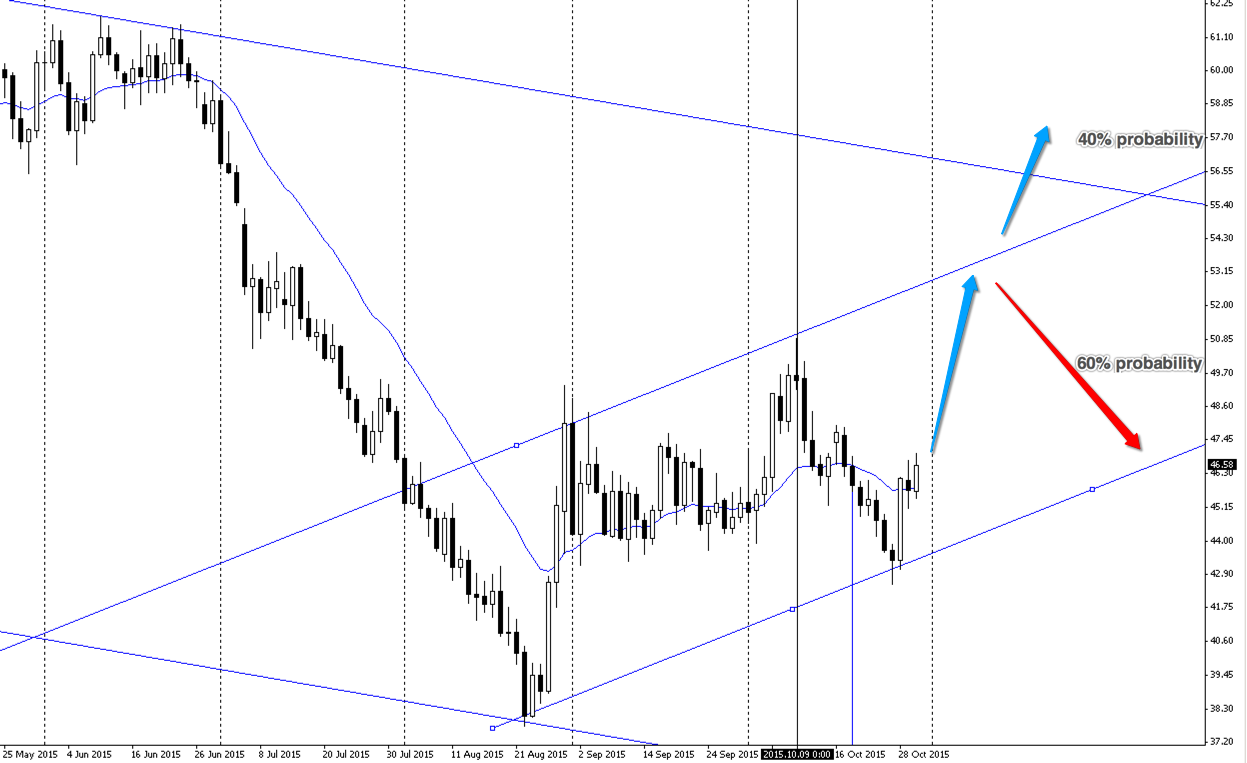
    Crude Oil. A wide trading range has developed for WTI. The Price of WTI moved down to coincide with the top of the first daily breakout. An expected phenomenon . The (buy) signal, although bearish on the daily chart, was good in hindsight; however, I will look for a second entry opportunity to go long if price retraces back to the lower trend line and again provides a good buy signal. After that, I’d expect price to climb to the top of the channel that I’ve drawn with a 40% or 60% probability of ascending or descending respectively.

    Snip20151030_19

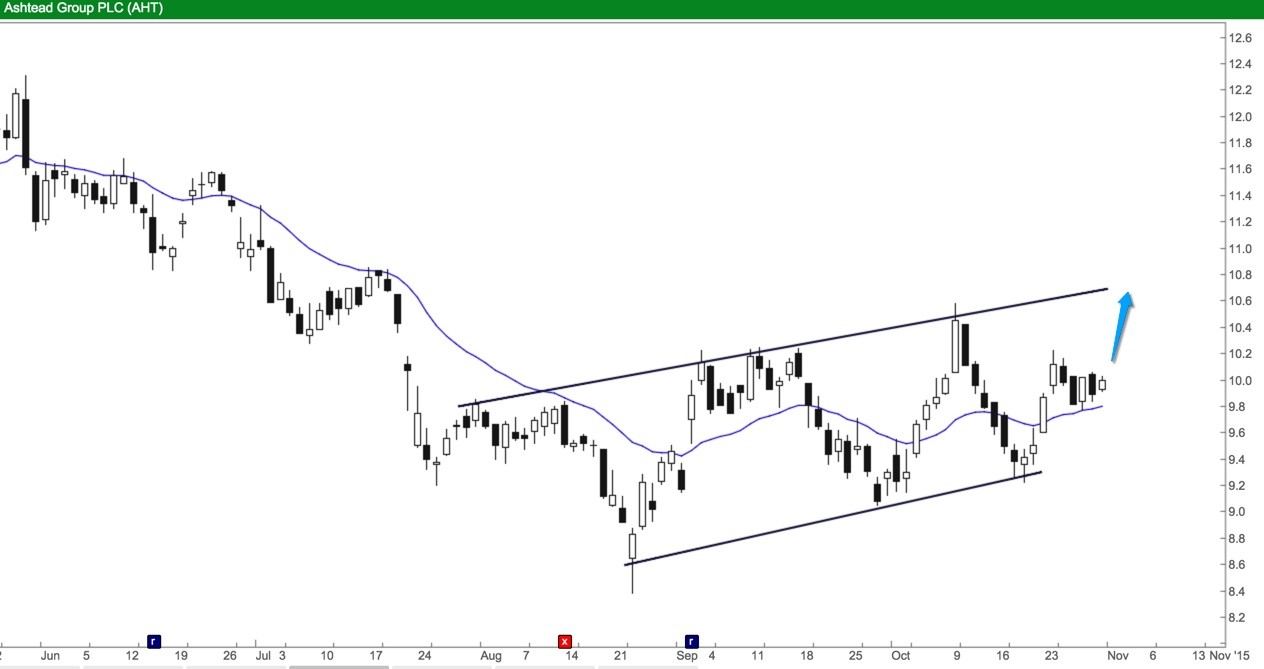
    We remain in Ashtead Group PLC with a target shown by the blue arrow below.

    Snip20151030_20

    Finally, A reminder that Slow Trader values will be provided every first Saturday of the month.