Not really the trading period I was looking for to progress my twelve-month trading challenge. A couple of weeks after my last post, I didn’t record any trades. I turned up every day, but just watched and waited. Such a cold market. No opportunities for me. Probably opportunities for the larger fund, but even those, I suspect, would have been weak and fleeting.
Some improvement, however, as we entered March. When I say ‘improvement,’ a few stocks in early March showed strong momentum. VCIG, a consultancy firm, was one. There were also a couple of Biotech and Pharma stocks, which remain my preferred low float opportunities. Other than that, Artificial Intelligence stocks moved occasionally. More recently, energy and defence stocks have moved, albeit irregularly.
Previously, many stocks would have bounced significantly, but at the moment, I’m happy with a few cents of positive movement. This change in my expectations stems from the extended periods of waiting—weeks in February and days in March before a trade opportunity appears.
These waiting times can leave me open to mistakes. To mitigate this, recording past trades on the tape (level 2, time and sales) for simulation would be highly beneficial. For example, when a trade popped up recently after days without activity, I entered it manually (rather than using hotkeys or hotbuttons). Still, I didn’t update the inside ask price before hitting the buy button.
The difference was 30 cents higher than the anticipated price. The stock had a particularly low float and a significantly high relative volume. My limit order was executed immediately. Yes, I did manage to get a 70-cent profit. But with better execution, that profit would have been a whole dollar. Multiplied by the shares traded, it’s easy to calculate the difference.
I primarily trade with hot keys tied to the ask price. I choose the ask over the bid, unlike most traders, due to my reactive style. I avoid predictive setups whenever I can. Though I sometimes slip, I’m improving at staying reactive.
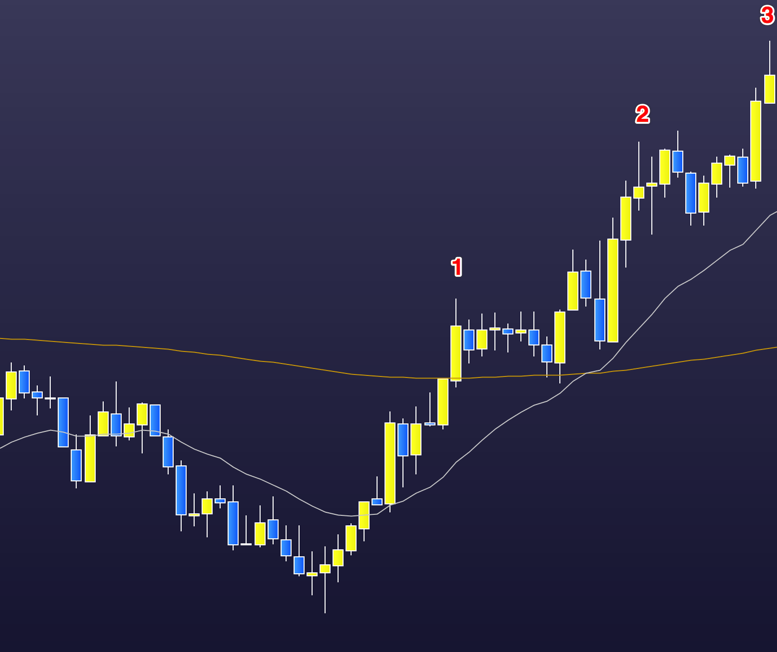
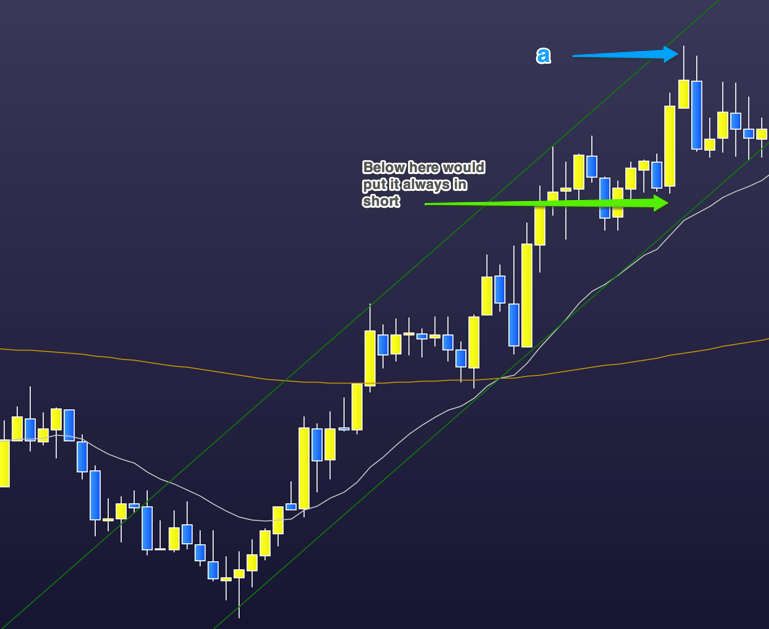
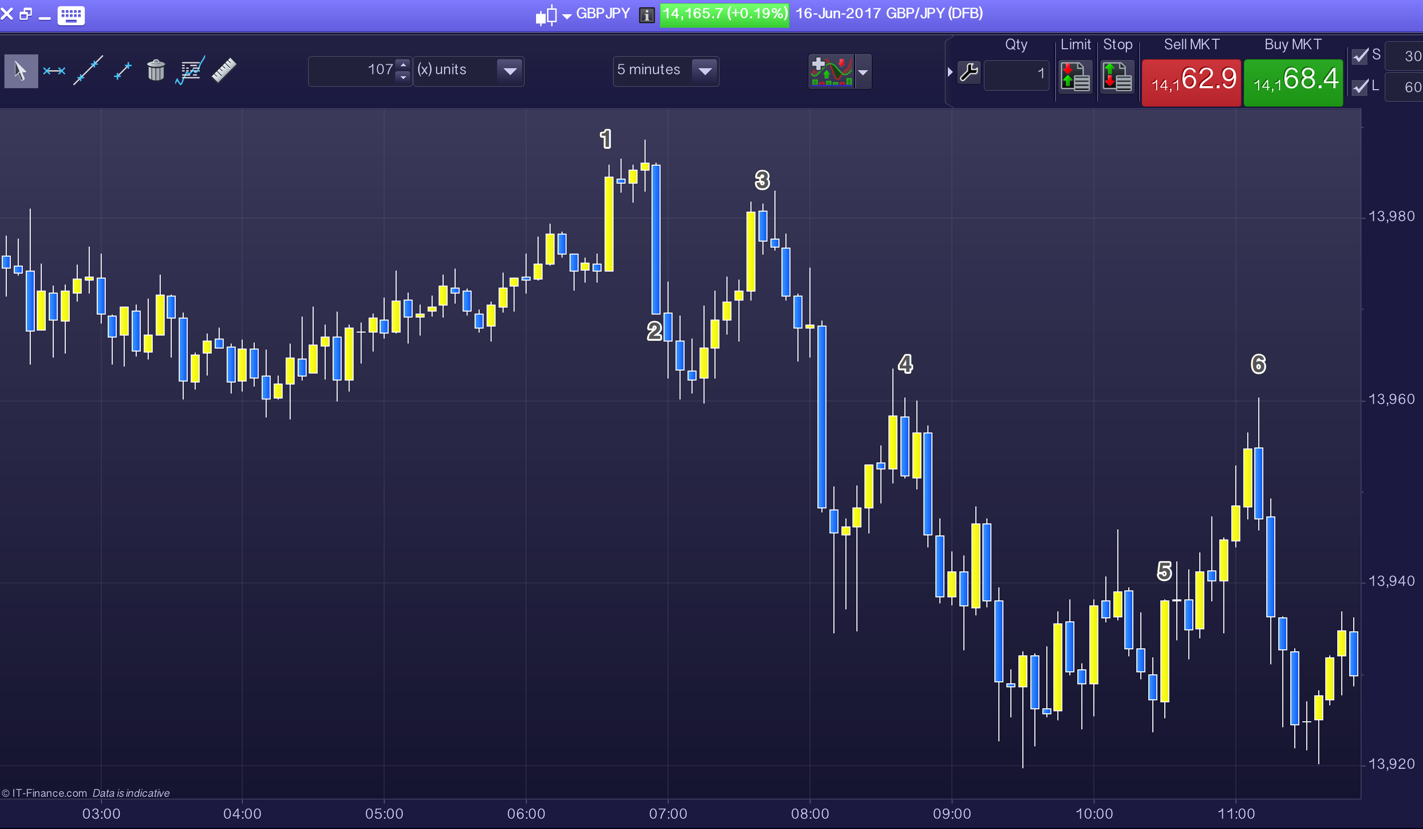
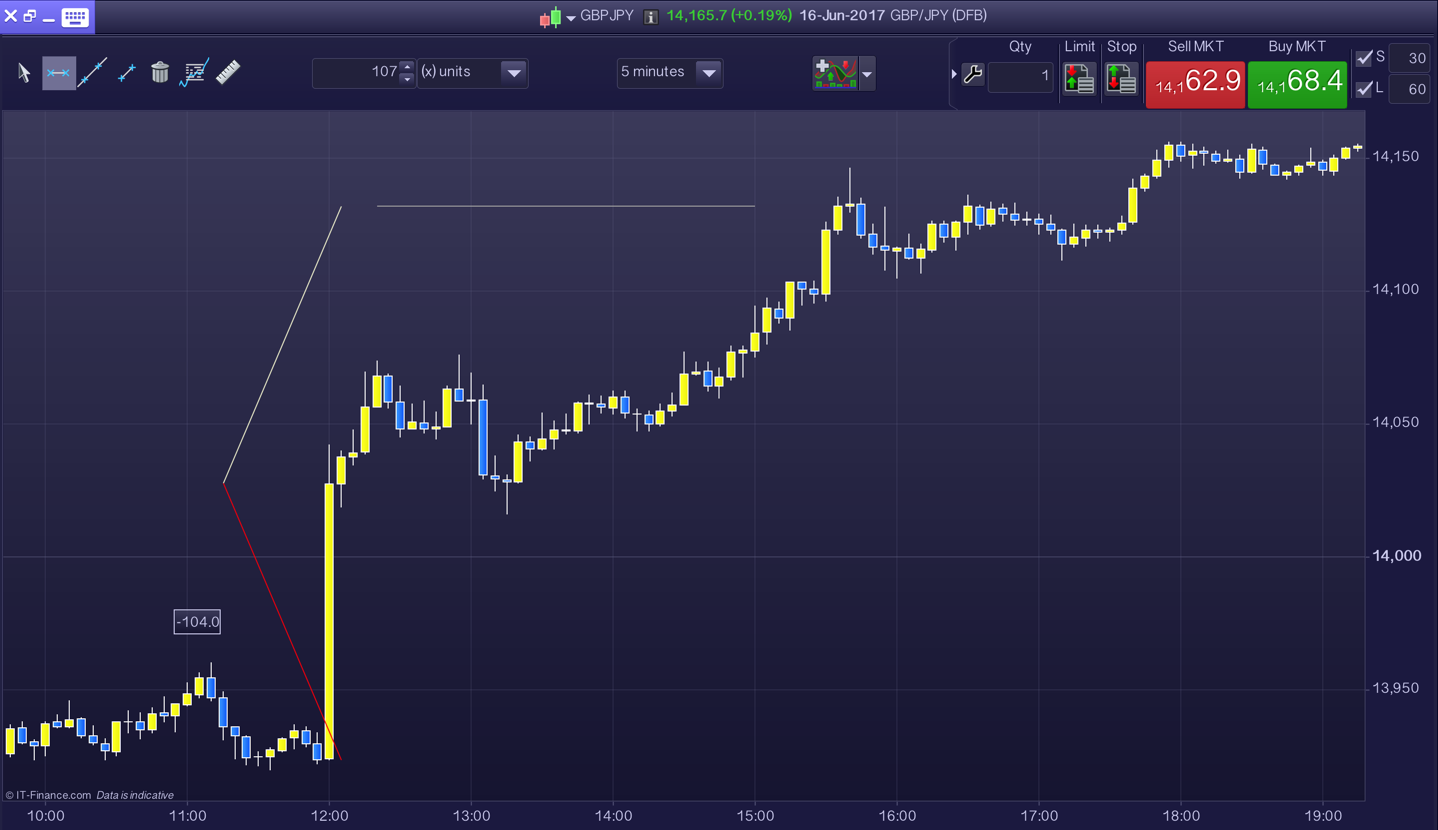
Let me explain what I understand as a reactive trade. As Lance Breitstein says, “trade on the right side of the V.” For me, that means whichever timeframe we’re using on a chart, the green bars (long) are winning. This is as opposed to red bars (shorts) winning.
It is always easy to look at a chart in hindsight and, with total confidence, say, “This is the entry.” This perspective often shapes how most YouTube courses and the like sell their methods—it looks so obvious in hindsight. But, in real time, it is not as clear-cut. That’s why it is so important for each of us to find what works for us.
Whether we are good with rapid change, whether we can read signals—be it price action, indicators, or both—and which combination suits us best and how proficient we are at reading the tape. Personally, to ensure I’m being reactive rather than falling into the predictive trap, I primarily use the tape. I check the fundamentals that matter to me, and once I have a suitable reaction on the tape, I check the chart for a worthwhile trade setup. This step-by-step approach helps me stay reactive.
Sometimes a trade entry can follow this simple sequence, especially when the stock is moving so quickly: I glance at the necessary fundamentals, see the tape take off, check the chart for structure, refer back to the tape, and, a moment later, I’ve taken the trade. At this stage, most of my attention is now glued to the tape.
More often than not, the process is slower. In these cases, I mark resistance levels on the chart and examine all necessary timeframes for clues. Then, I wait for the tape. The danger is during this wait, when we try—consciously or subconsciously—to predict price and chart structure.
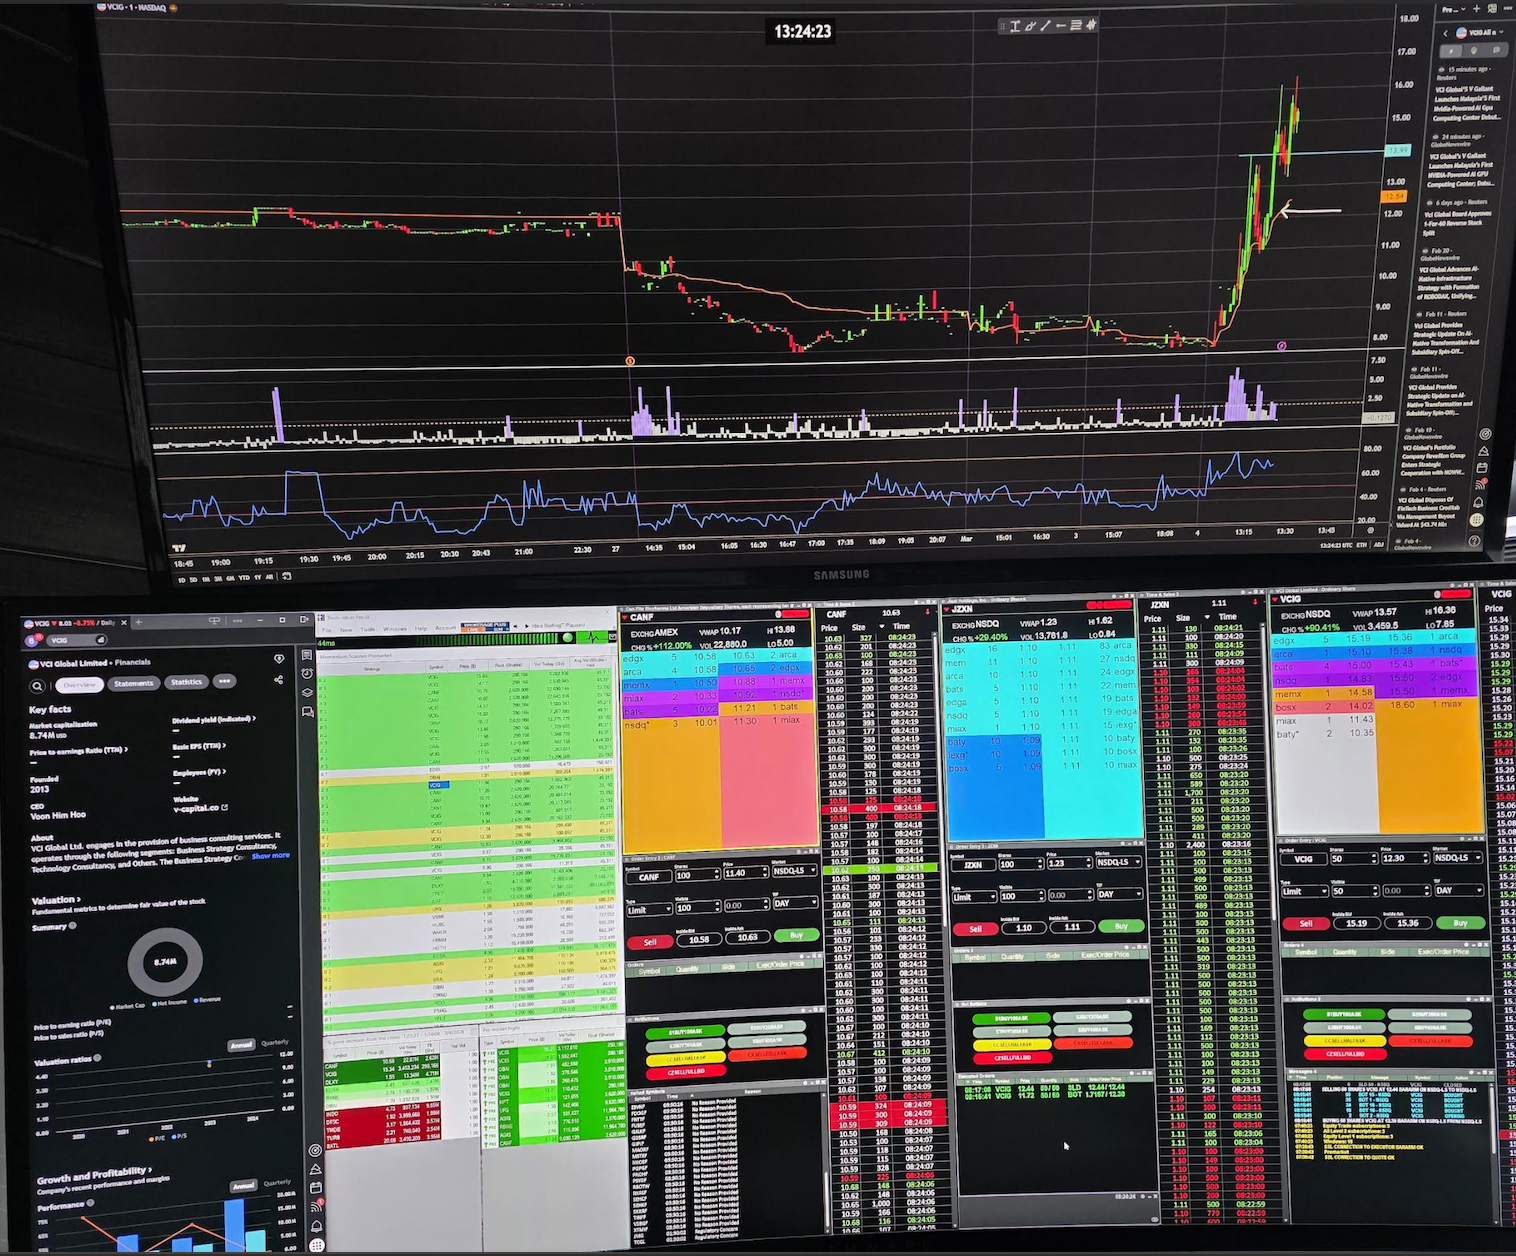
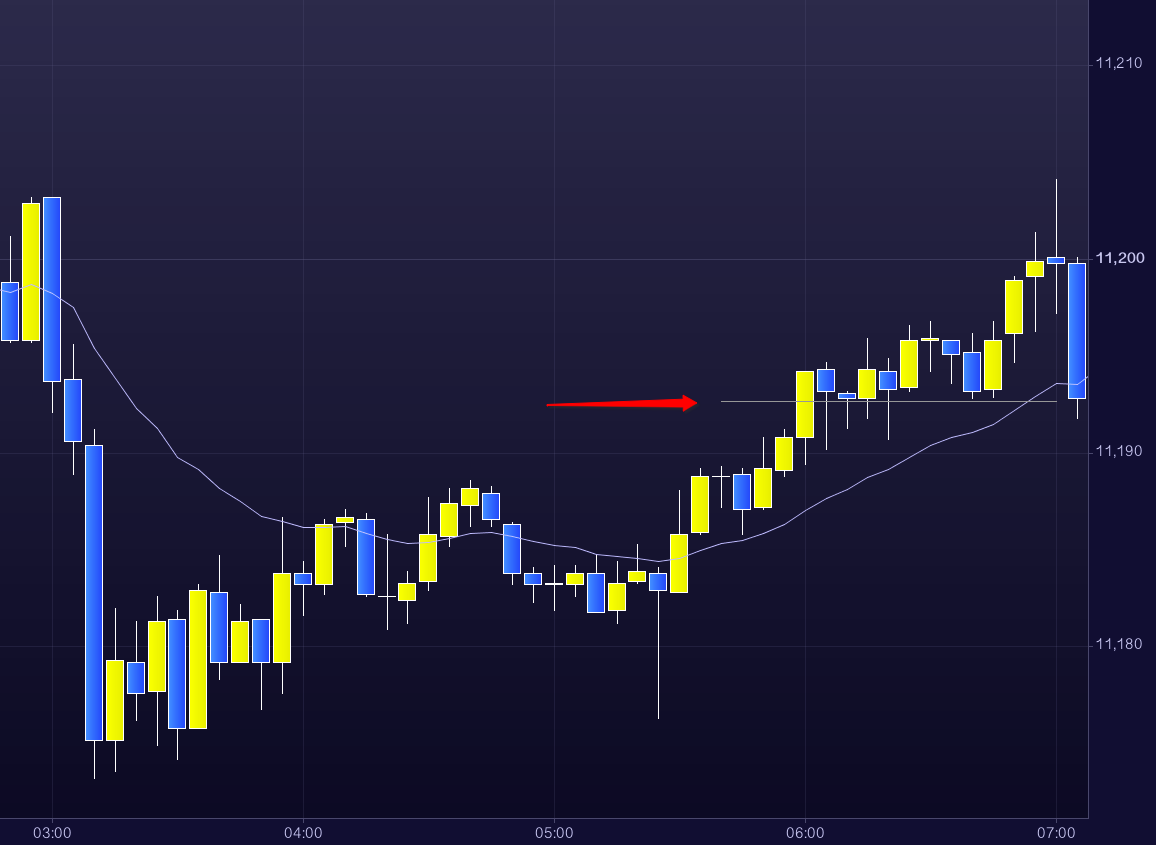
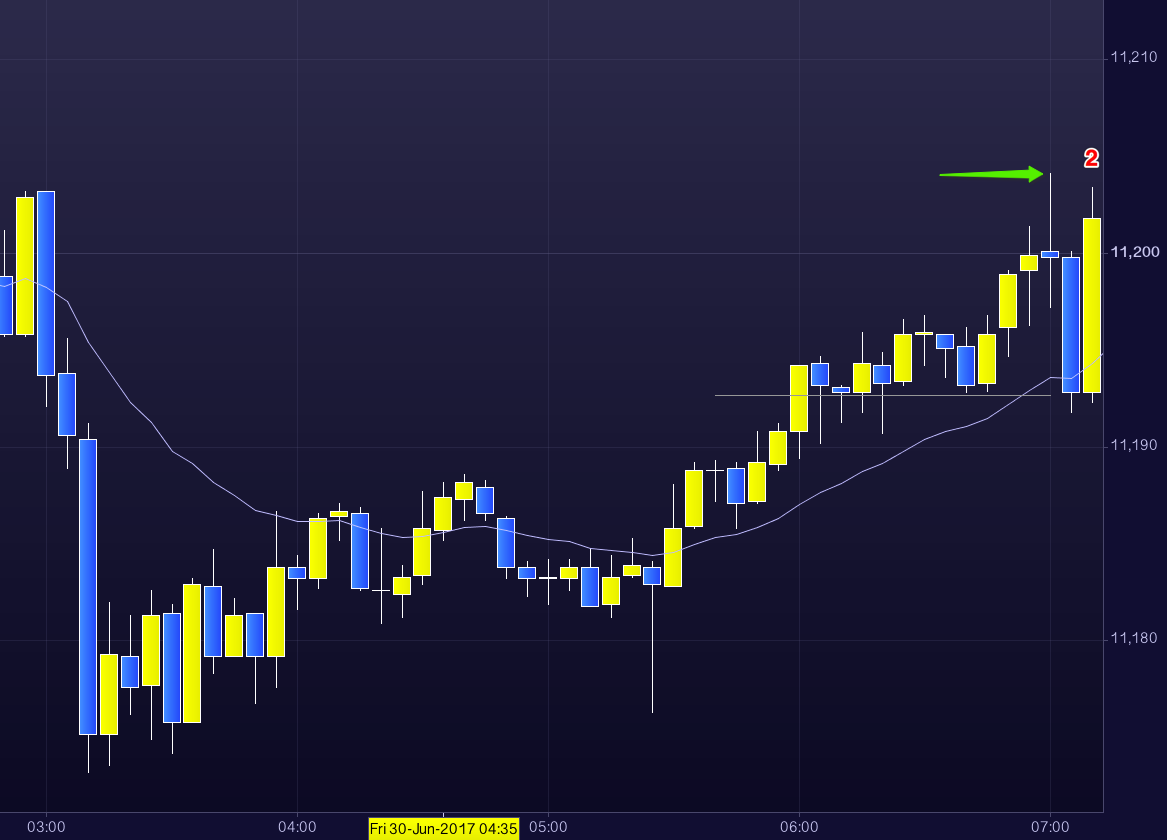
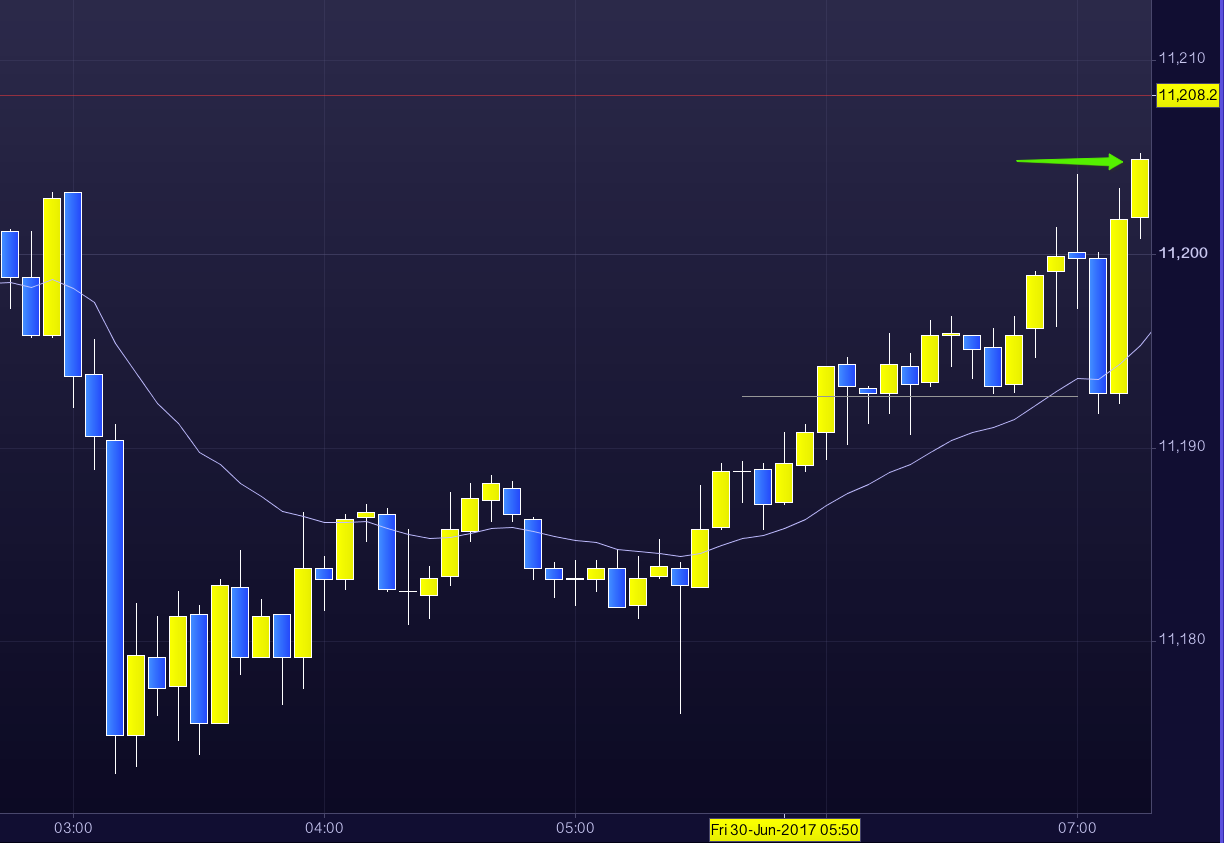
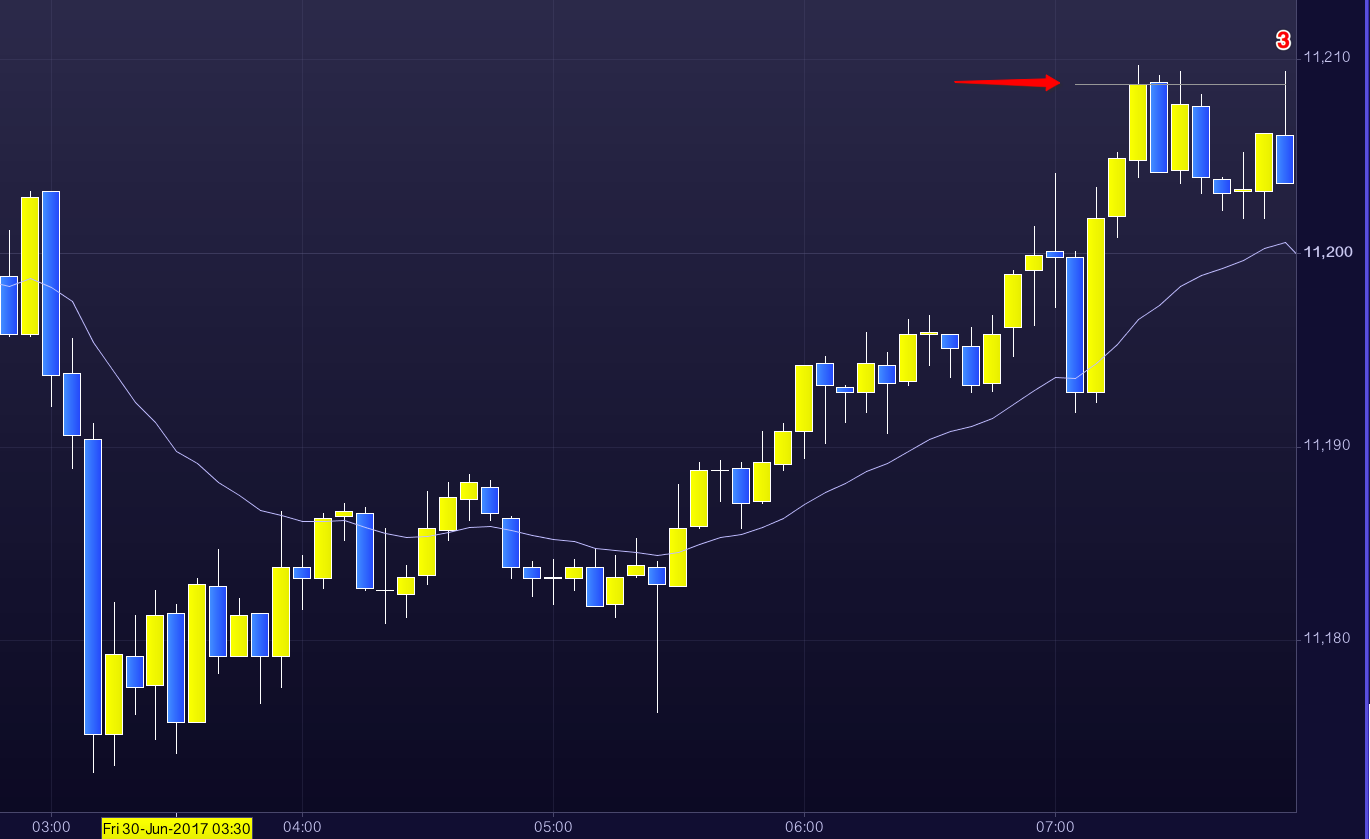
The arrow on the chart above shows an entry. Notice how, for me, the level 2 and time and sales dominate the area rather than the chart itself.