Tag: USD CAD

  • A neutral few days

    A neutral period looking for re-entry opportunities, but nothing taken this week.

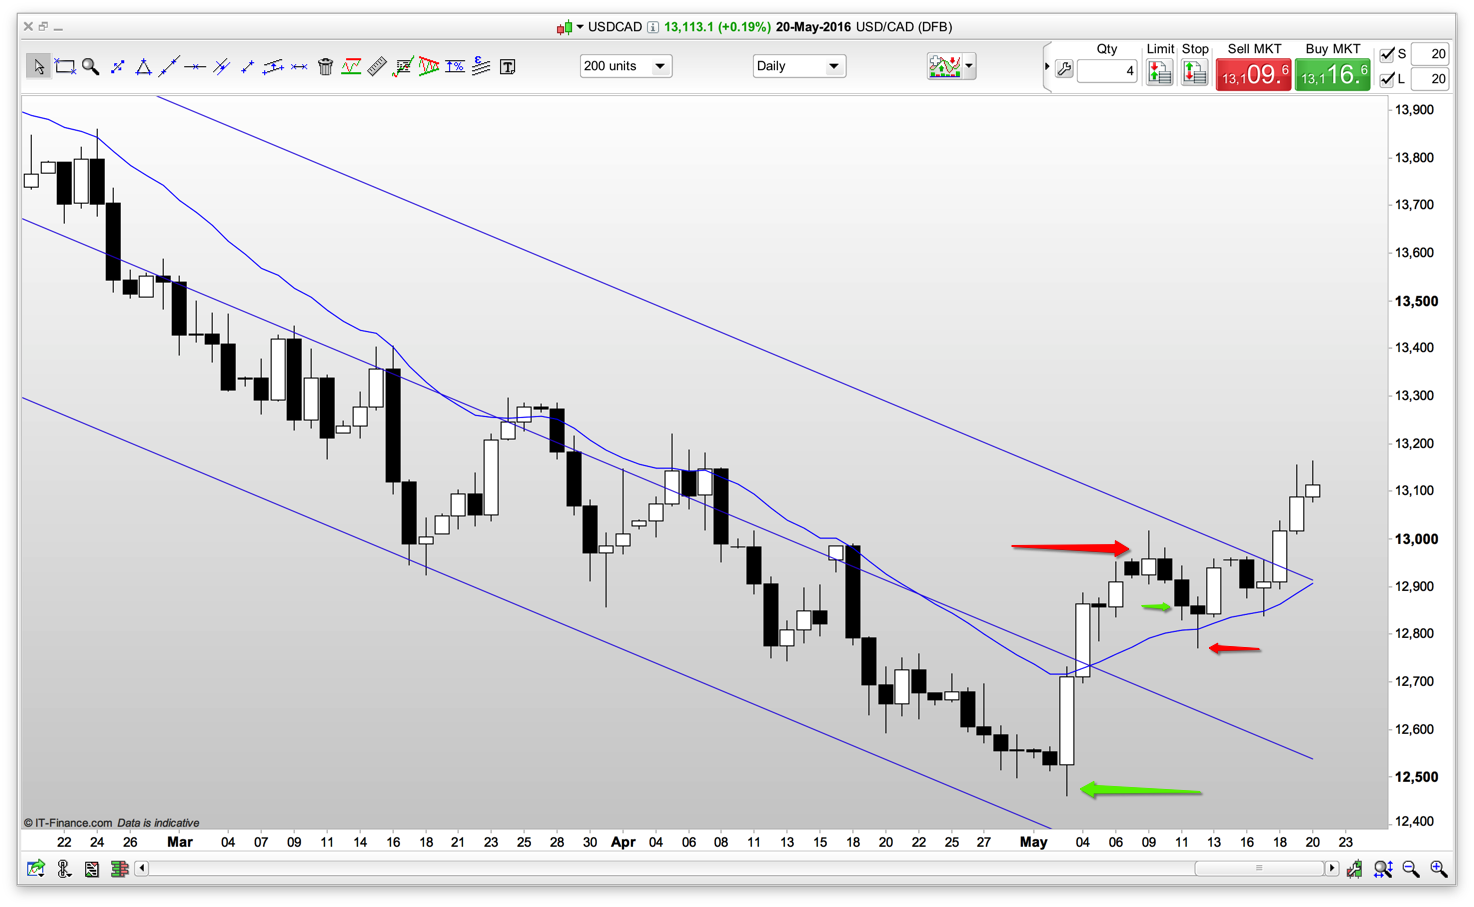
    USD CAD seemed to take-off only to pull back to the weekly support line. A good buy opportunity now – or a few pips lower.

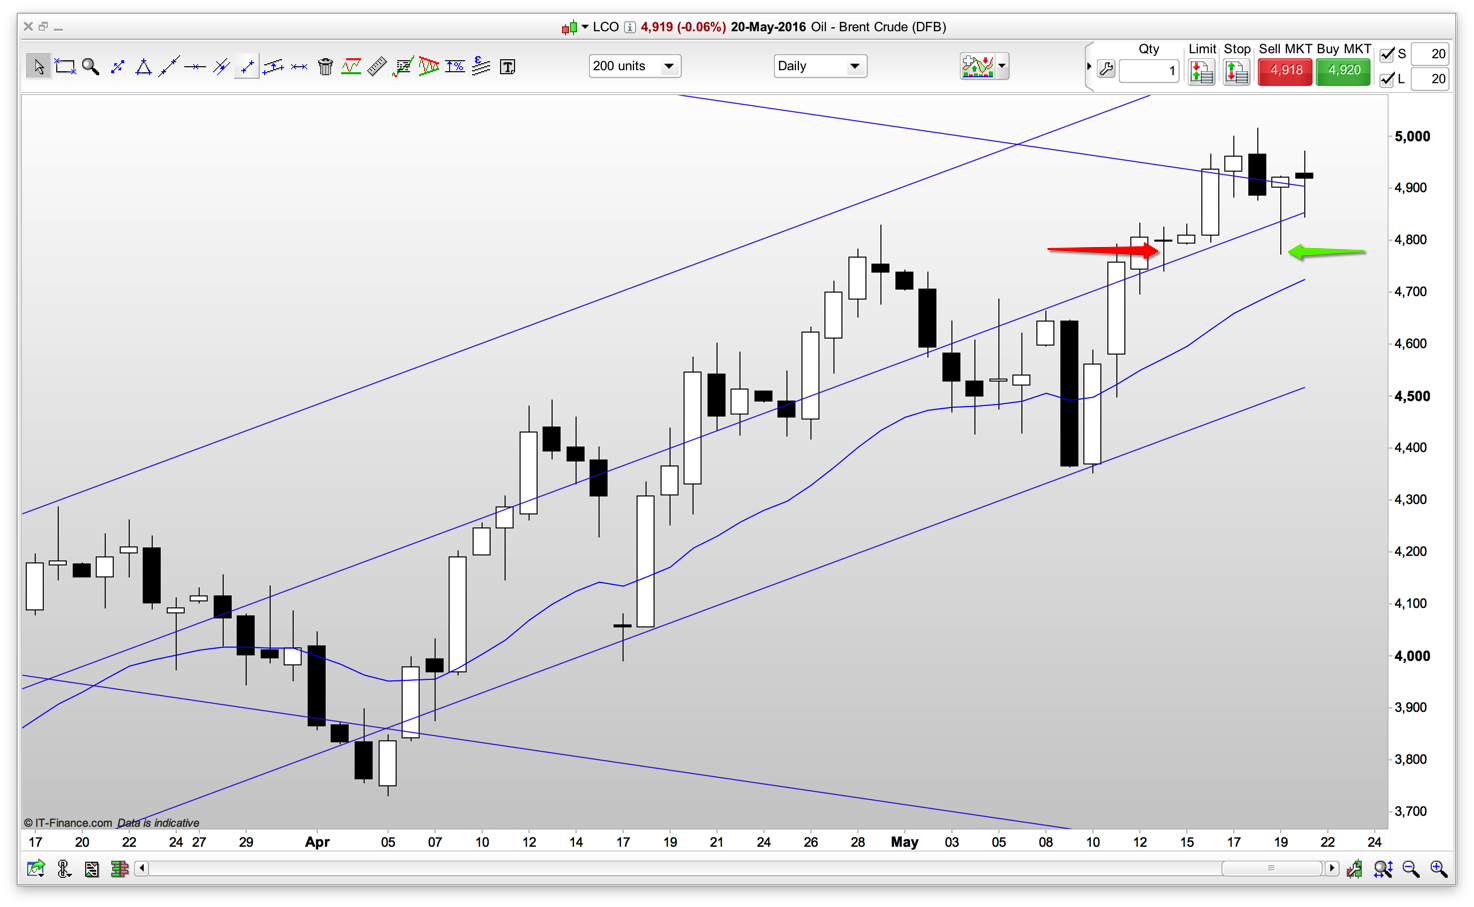
    Brent crude oil is at a position – that we projected a few weeks ago – that is ready to short. We will take shorts from the hourly chart (rather than the daily) as we feel oil is more easily managed from the hourly (rather than the daily) chart.

    Silver provided a reasonable re-entry short opportunity on Thursday. Missed that, but a second chance may present itself again this week.

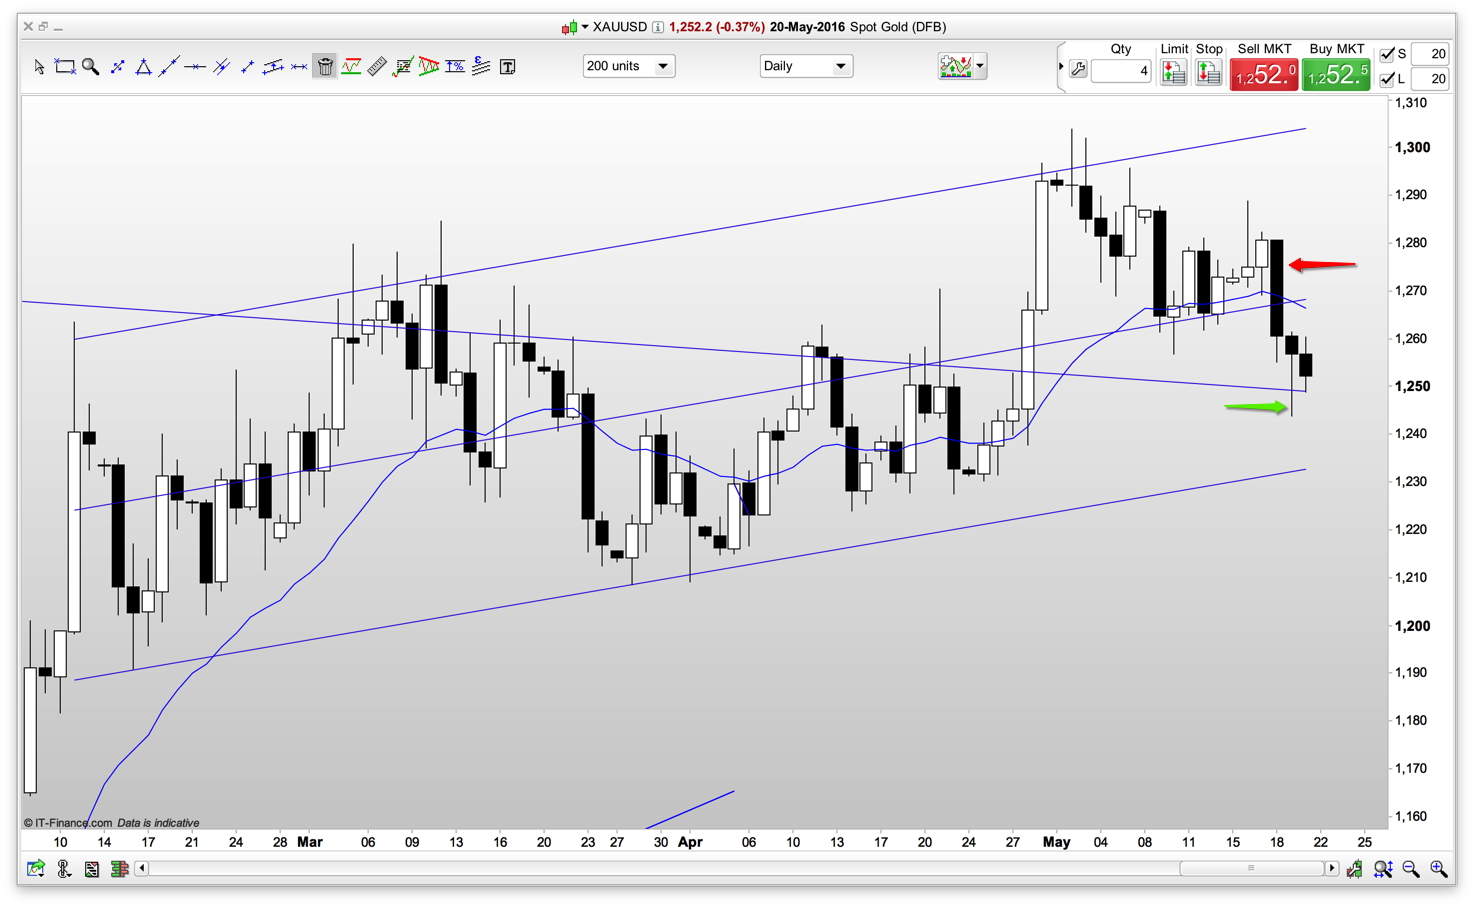
    Gold has dropped just over 30 pips from where we took profits at the end of last week. Now likely to drop a further 20 pips before meeting a monthly resistance line. If we get a retrace we will take a short as gold has the potential to drop a further 70 to 150 pips over the next few weeks.

    We have listed a new page called strategies. This is written (and added to and changed most days) in a short format – as if we are preparing the ground for a computer algorithm. Therefore of little meaning to a non trader. However, it provides an idea of the precision involved.

  • Profitable gold and silver – missed USD CAD

    A good week with profitable trades in gold and silver. The week did come with a small loss and missed opportunity in the currency pairing USD CAD. Also, we were out of the money for much of the week in crude oil only to grab a brief break-even buy back moment. Overall, a good week.

    Silver daily chart: each bar represents one day’s worth of trading. A black bar means the price closed lower than the open. Each candle (as they are called) shows the open and close price and the wick (either top or bottom) shows how high or how low the price actually went between the open and close times.

    Snip20160521_1

    We shorted silver at the red arrow and we bought back that short at the green arrow. Just over 80 pips of profit for us; a pip is the smallest upwards or downwards movement. (In stocks and shares it is called a tick.)

    Gold daily chart:

    Snip20160521_2

    We shorted at the red arrow and bought back our short for a profit at the green arrow. Gold trades less than silver per ounce and therefore our gold movement this week represented only 30 pips. However, the smaller size is offset by the traders equation: based on probability, our profit target, how far away our stop is and the representative amount we’re prepared to lose.

    USD CAD daily chart:

    Snip20160521_3

    Over the last few weeks we went long at the larger green arrow and took our profits at the larger red arrow.  We went long again a few days later at the smaller green arrow only to be stopped out of the trade (within a couple of pips!) at the smaller red arrow for a small loss. I then missed the subsequent move up. That is trading. Did I set my exit stop at the wrong place? Maybe. Hindsight is a wonderful thing, and a few more pips below the moving average would have been sensible. But my overall judgement was correct, in that the price was going to go up – and I take confidence from that.

    Crude oil daily chart:

    Snip20160521_4

    My best trade of the week without making any profit. Let me explain. We shorted at the red arrow and were out of the money all week to the tune of 200 pips at one point. We bought back our short at break even price at the green arrow. Best trade because although we were out of the money we did not reach our stop position and we managed a break even price. Ready for the next one!


  • gold and silver – are prices ready to drop?

    Copper – An uneventful week for the commodities. All except copper which moved down without us and with gusto. Copper, however, had an unclear read on the COT (often the case with copper) and an unclear read on the daily charts. Therefore we are correct to be out – as to stay in would have been to rely too heavily on hope.

    Crude oil and USD CAD – We hold a small position on crude oil short. But a 200 pip climb is likely and at which point we may add to our shorts. USD CAD, which often reflects a delayed but exact opposite price movement to crude oil, shows a clearer picture. Too much reliance on the difference between these two charts (crude oil and USD CAD) is, however, a ‘chicken and the egg’ question and should be considered but not relied upon.

    Gold – Having taken some profits (short) from gold last week we continue to hold a small position short. Expecting to add to shorts anytime this week. Net position of the commercials remains at a 5-year low. This will provide great momentum to a drop in the price of gold if gold price per ounce falls to the $1,200 region.

    Silver – Similarly with silver. We took some profit last week and continue to hold a small position short. Looking for a price climb to $1,730 before adding to shorts. Silver, however, has an even more dramatic picture on the COT as the net position of commercials is at a 10-year low. As with gold, any significant reduction in the price of silver will probably result in an exaggerated acceleration short.

    Intraday strategy – As an aside, much work has been done this week developing our short-term momentum strategy (namely using GBP USD intraday charts) on trading range breakouts and subsequent channels. I know this doesn’t make a lot of sense to the investor, but to a trader it is a high probability strategy with measurable risk and reward. And possibly the most lucrative of intraday strategies.

  • We take some profit from gold, crude oil and USD/CAD

    Until now we have traded the commodities: gold, silver, copper, crude oil and USD/CAD on a weekly basis. That is referring to weekly charts and a weekly COT report. We have also, as discussed last week, considered introducing the fund to intraday trading.

    Each of which (weekly and intraday) are rather on the extreme. On one hand, we have the overly slow weekly chart market, and on the other, the rather demanding intraday market.

    The balance for the fund is daily charts. Why? …weekly charts are emotionally difficult as we see good profit generated only for that profit to disappear as we remain invested in order to reach our target. There is no compromise here, because to take profit before a target, unless our premise changes, does not provide a traders equation (that is: the trade had more risk than reward).  Over the longer term this would be a losing strategy.

    Gold and silver have emphasised this over the last few weeks where they dropped in price to provide us with good profit potential, only to extend higher than I considered.

    Daily charts, rather than weekly charts, usually means tighter stop positions and therefore lower risk, but in contrast our targets are shorter. Timing wise we are in trades for a week or three rather than several months.

    The COT suits the weekly charts, but often goes against my daily chart readings. This of course happens at all levels of chart, for example, the difference between the daily and the 4-hour chart or between the  5-minute and the one-minute chart. However, I report weekly and to have a profit at the end of one week only to know that profit will go away as we wait for the bigger (targeted) profit seems emotionally foolish.

    With moving to daily charts, our targets are closer and therefore we can take profit more regularly (if available) and wait for the next entry. This means that we will occasionally miss the big move – but trading is rarely perfect.

    This week we took profit from our short in gold as it sank from its high of the previous week – and before Friday’s monthly non-farm payroll brought it up again. Also, we took profit from a short in crude oil as it came down over the week and from our long in USD/CAD as, conversely, it climbed nicely over the week.

  • Gold and Silver finish week on a high

    Silver finished the week on a strong move up. Silver is at, or slightly above, a three-year trend line. The COT shows the net position of commercials at a multiple year low; meaning the majority of commercials (the big buyers and sellers) have short positions on silver. As do we. Difficult to hold through, but that is the strategy.

    Gold provides, as it so often does, a similar picture to Silver.

    Crude oil ventures up towards the position suggested on my charts last week. A possible short on crude may present itself this coming week.

    USD CAD had little movement in weekly chart terms.

    Copper dipped early in the week and gave us a reasonable out position. Copper reversed back up by the end of the week as anticipated.

    The strategy on commodities is to go long or short reasonably early based primarily on commitments of traders (COT) information and supported by analysis of weekly charts. We use weekly charts as that corresponds to the weekly COT release. The COT is released UK time late Friday evening and is based on the previous Tuesdays collation of information by the CFTC.

    This strategy often calls for a significant period of time, several weeks or even months, where the trade is out of the money. Treat the COT as turning a large tanker ship analogy – it ain’t quick!

    To balance this ‘slow’ strategy we’ve decided to include a portion of the Slow Trader fund in our intraday trading. That sounds fancy, but is just a way of saying we trade with charts that are incorporated within the day. In our case 1, 2, 15 and 60 minute charts.

    In this instance we take as many as 9 to 15 trades a day and normally complete all trades before the end of the day. I’ll discuss our strategies for intraday trading in next week’s blog.