Price action does not need to be significant, but it helps

In our chart below, price action suggests probability but is context more important?

Trading Range

The hourly bar chart below shows a trading range (TR) and a possible breakout.

Bar 2 was a consideration for an entry short. If we look to the bars to the left, we see that the close of bar 2 was at or above the TR base (shown by a yellow arrow). Therefore, although bar 2 was prominent, engulfing the prior three bull bars, it did not, to our mind, qualify as an entry bar.

If we had taken the entry short at bar 2 our stop would have been twice the width of the TR, putting it marginally above the spike of bar 3. Weak traders had their stops taken by the peak of bar 3.

Price action, bar 3

Bar 3 provided a reasonable price action. The close of bar 3 was below the TR (the yellow arrow). However, most breakouts from a TR fail. Moreover, bar 3 was possibly the final push of a wedge, in this instance three drives short.

That provides us with a dilemma. We have a wedge and a prominent trend long. However, the price action (that is the shape of bar 3) provided an acceptable probability of a measured short against the trend.

How to measure our target. Unusually we measured the whole of bar 3, wick included and got a measured target some 92 pips below. The trade was exited with 36 pips of profit and at the 21st bar since entry. We try not to let a deal go beyond 21 bars.

Traders equation

Context overrides price action, nearly every time. In this instance, a 30 pip measured move for a scalp of the body of bar 3 may have been the more intelligent trade. The issue with that is the stop would have been three times further away than the target, therefore not a traders equation.

On that point, at least we took a planned 1R trade (that is reward/risk were equal). Our actual trader’s equation, the pullback against bar 3 and our entry, was 11R. In other words, our gain was eleven times more than our ‘actual’ risk.

Price action against the trend, scalp only.
Price action against the trend, scalp only

Trade by rules, not emotion and intuition

Those of us that want to trade the financial markets for a living technically, or make a profit doing so, have undoubtedly invested a lot of time, money and emotional effort into the process.

There are, however, certain aspects that, no matter what our chosen trading method, seem to be hurdles for us all.

Trading, for example, is full of contradictions. We need to hold our winning trades, but we need to know when to take profits. We need to make a traders equation, but we need distant stops. And we need to wait for a clear signal, but the so-called clear signs often don’t work.

A few trading conditions that I struggled with, and still do from time to time, include: not holding the trade all the way to target; entering on a whim of a signal, or worse no signal at all; and, my unfortunate favourite, trying to reverse a trade too early.

The latter is probably the single reason most traders struggle. I have an example trade from yesterday where (this time) I correctly held the trade from the currency pairing USD/JPY.

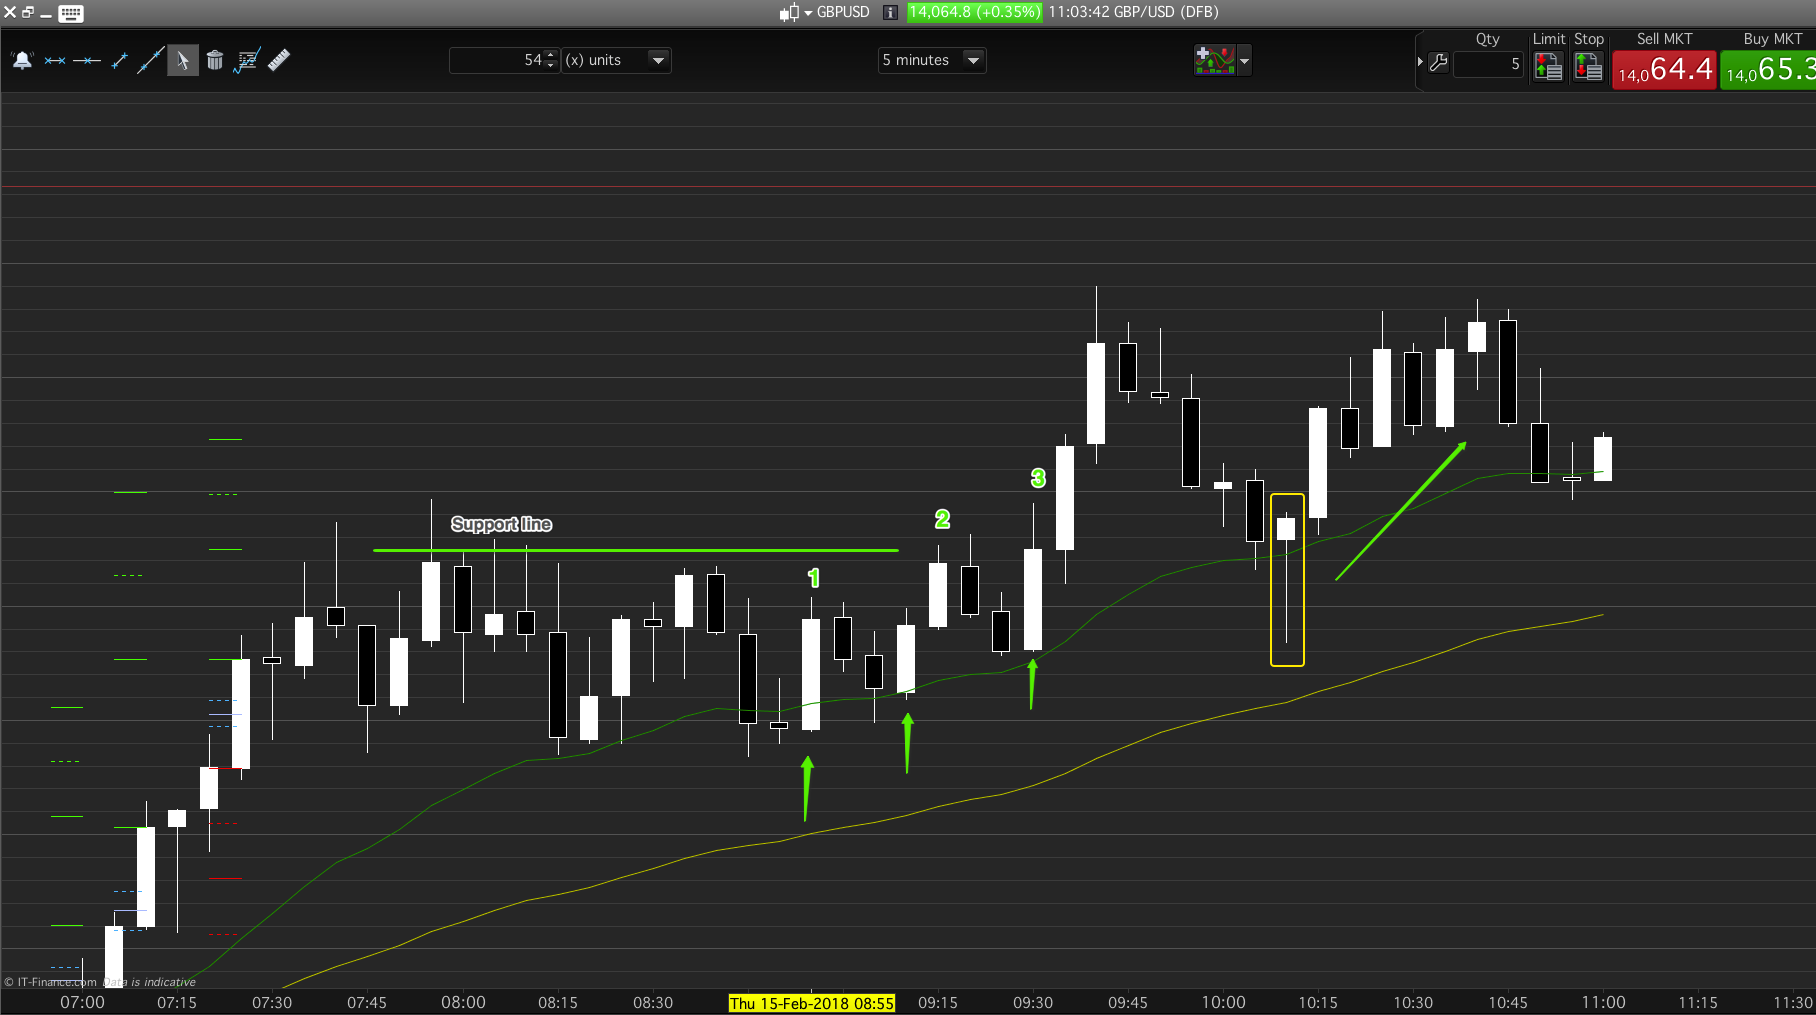
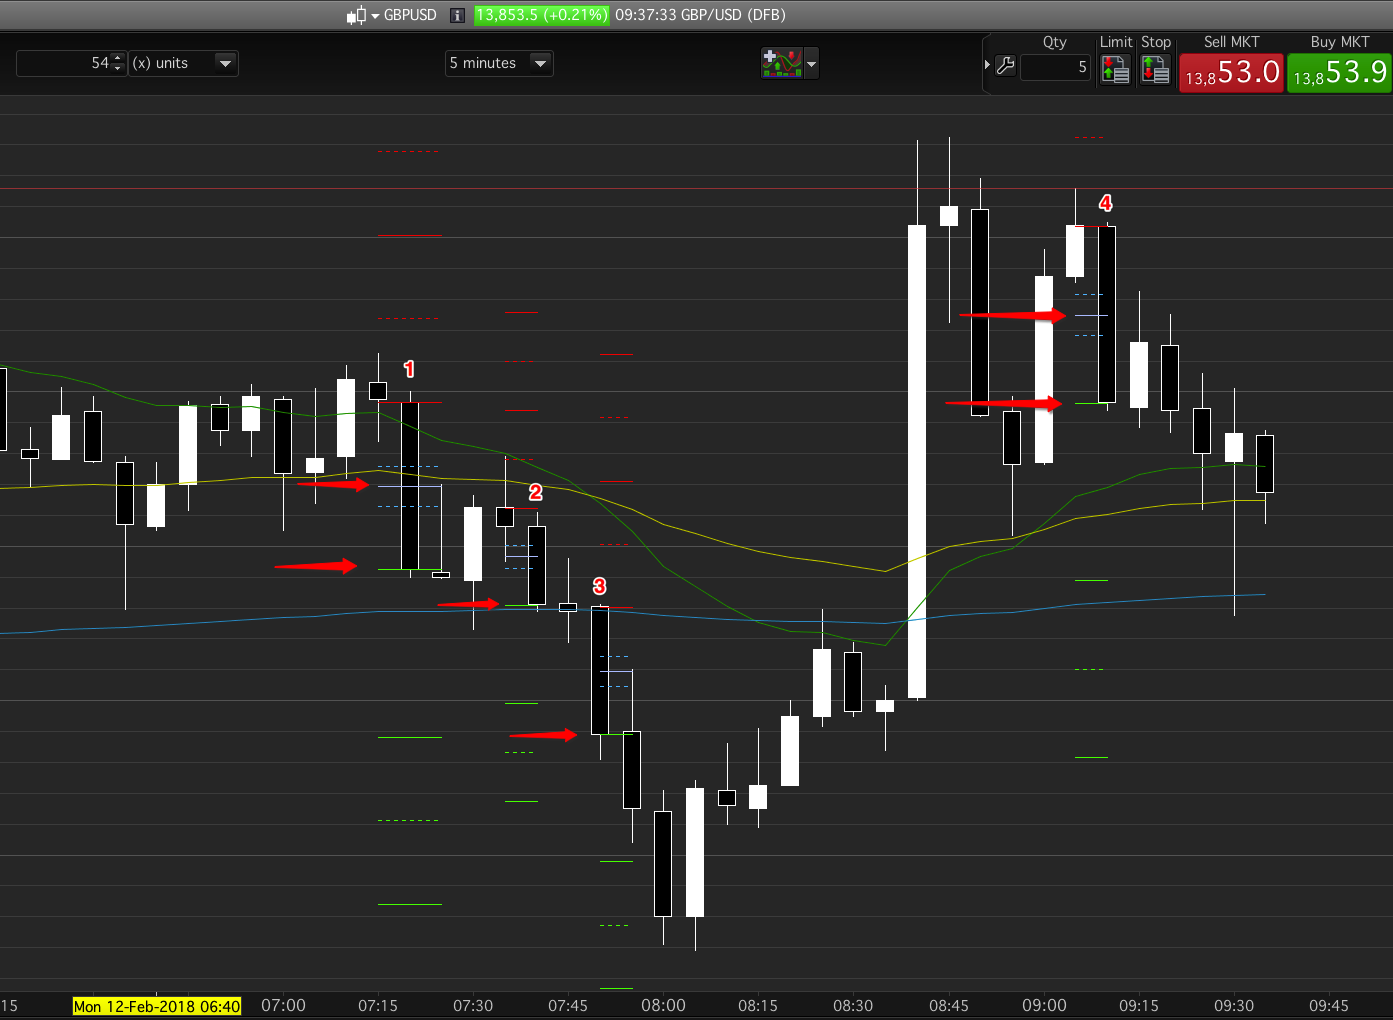
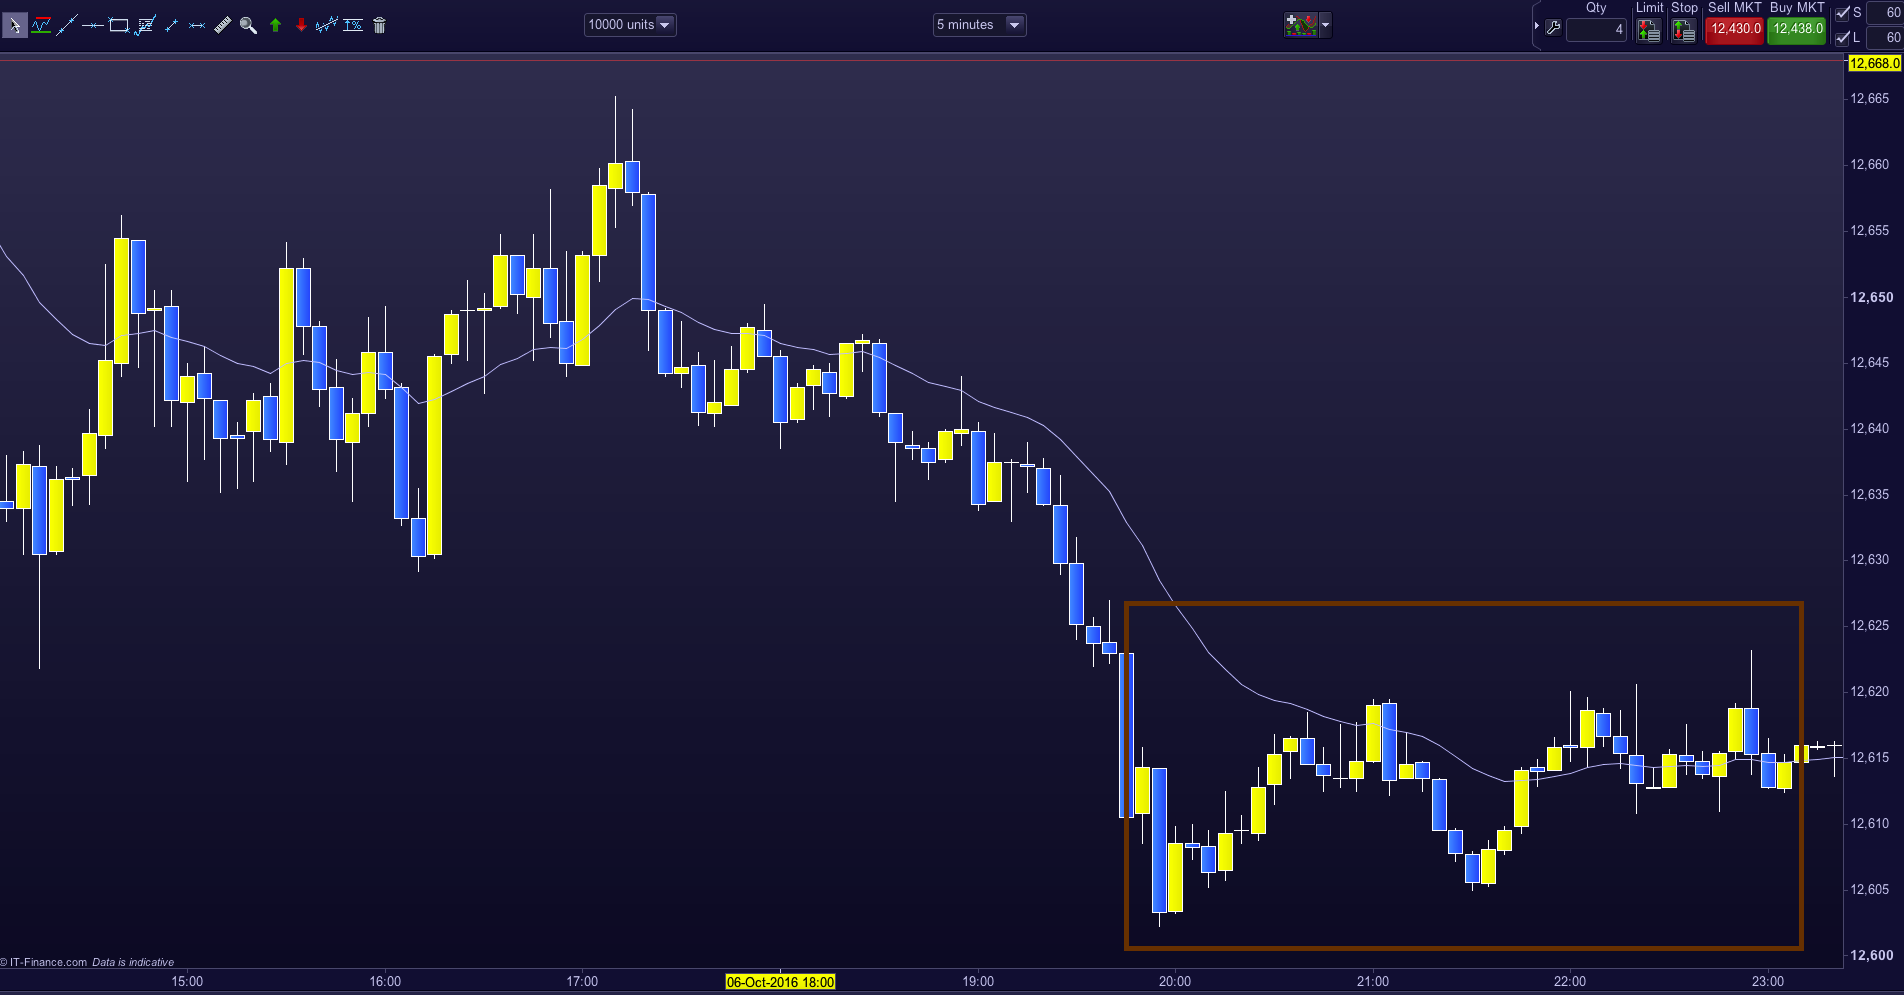
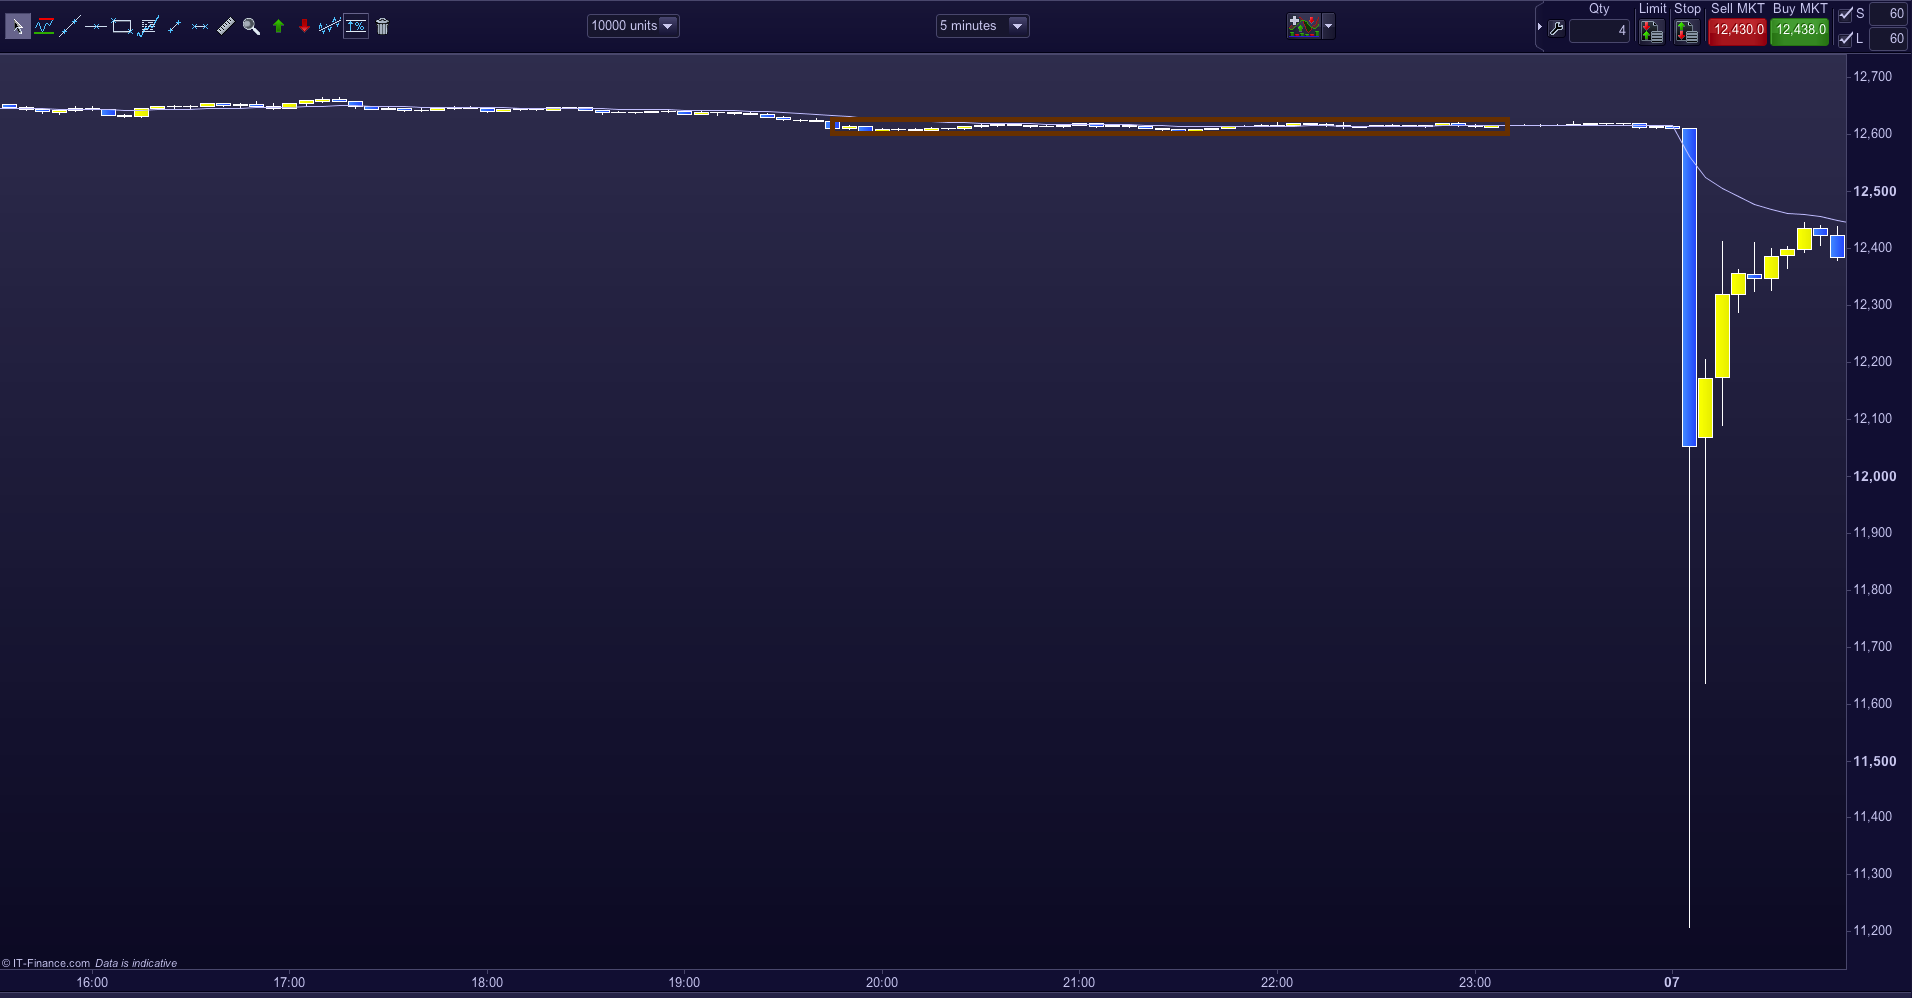
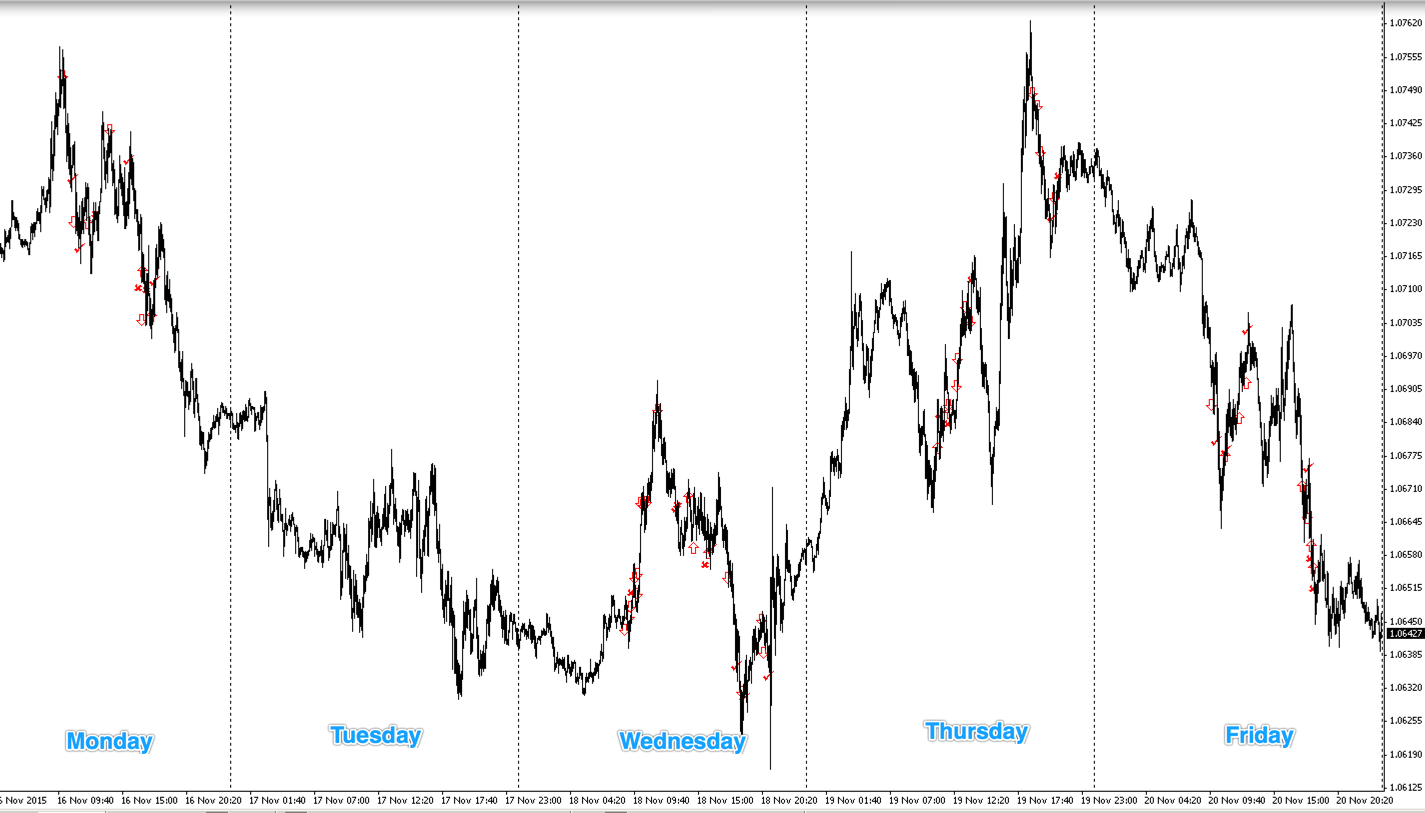
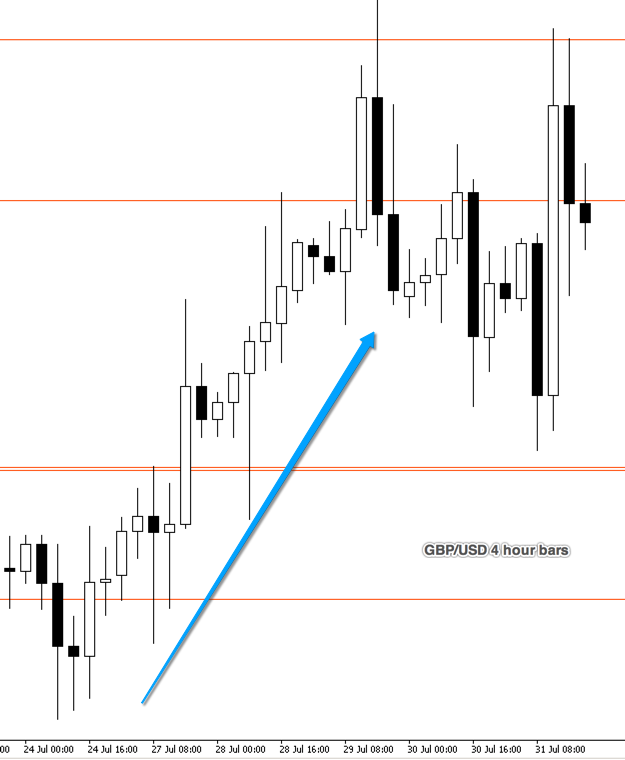
Firstly, I have to say that context is a big part of my trading strategy. When I show these snips, we are not explaining the overall background. That is, what price was doing leading up to the few bars we show on the chart. In this instance, over the last two days, the market had been in a steep descent, or bear trend.

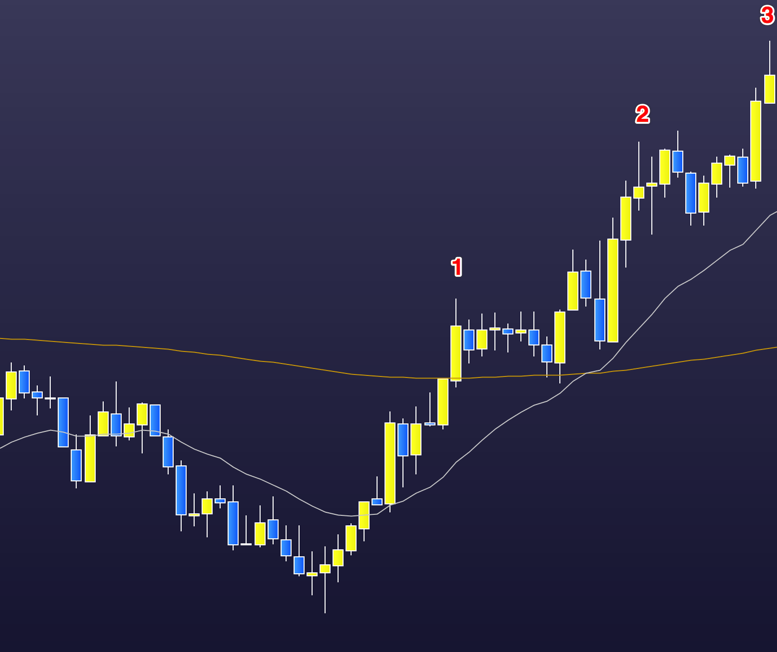
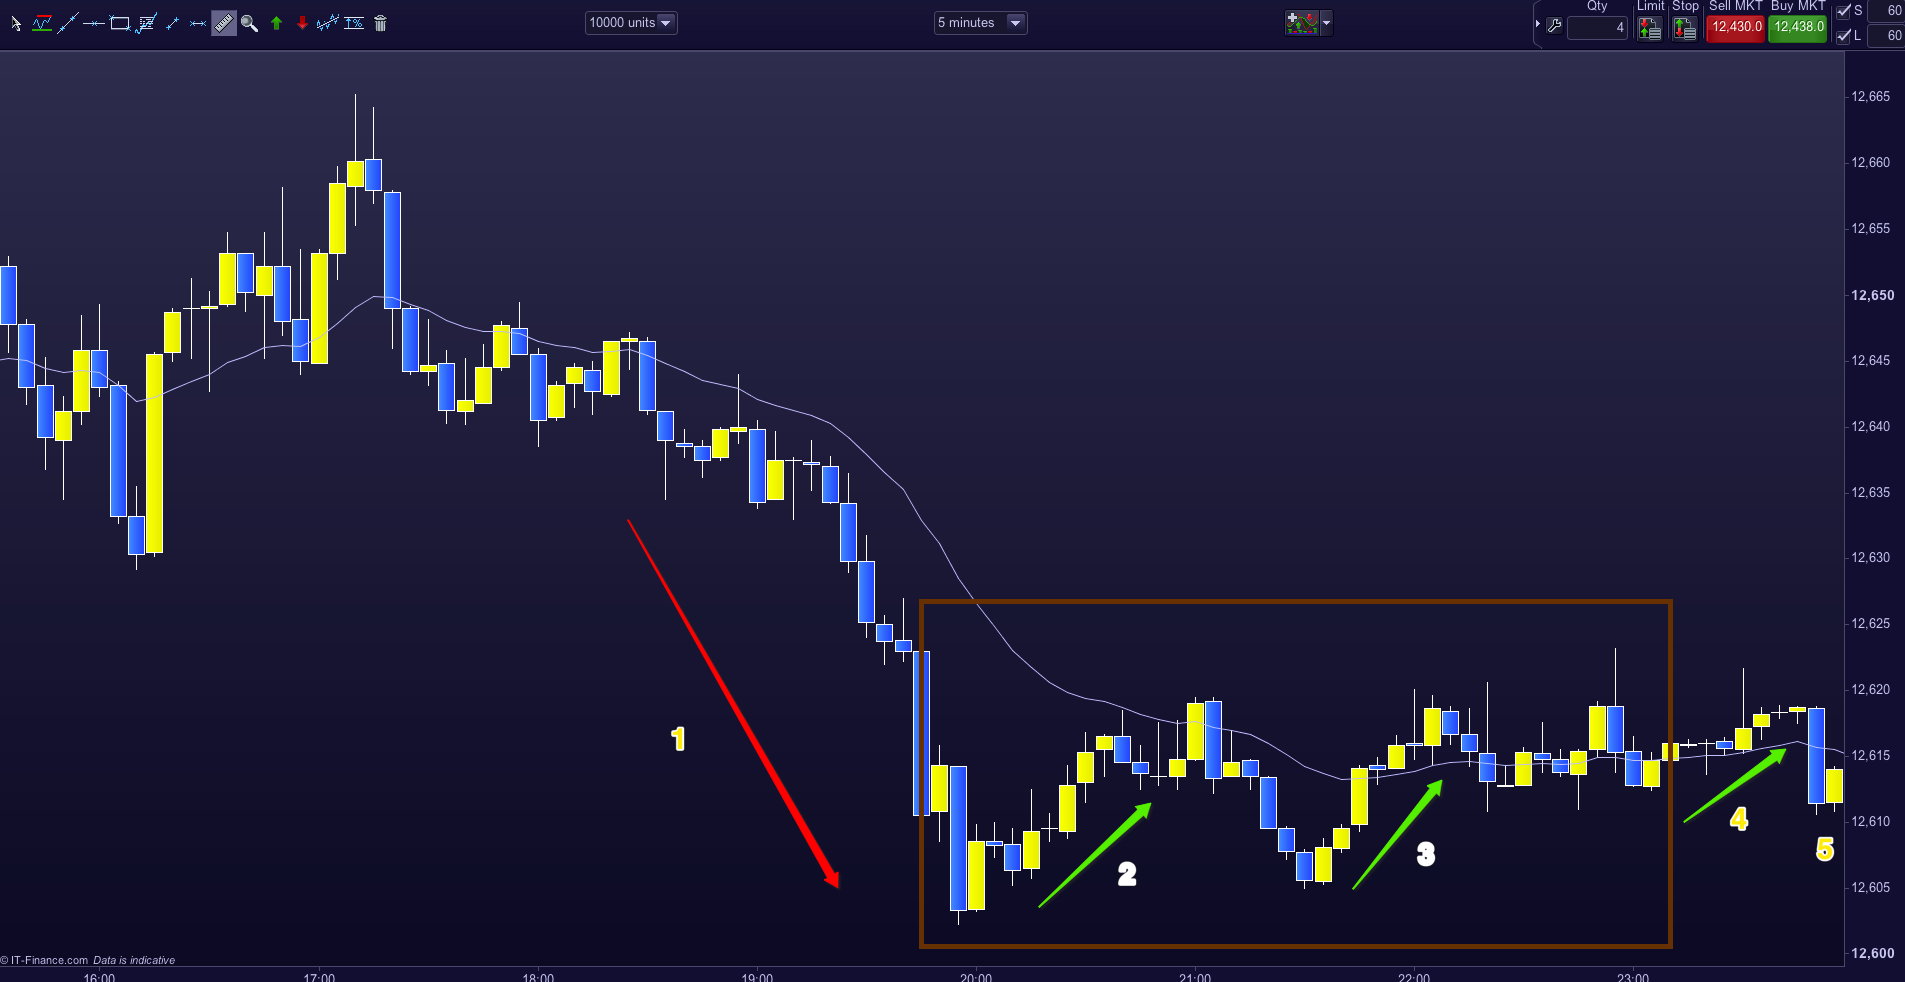
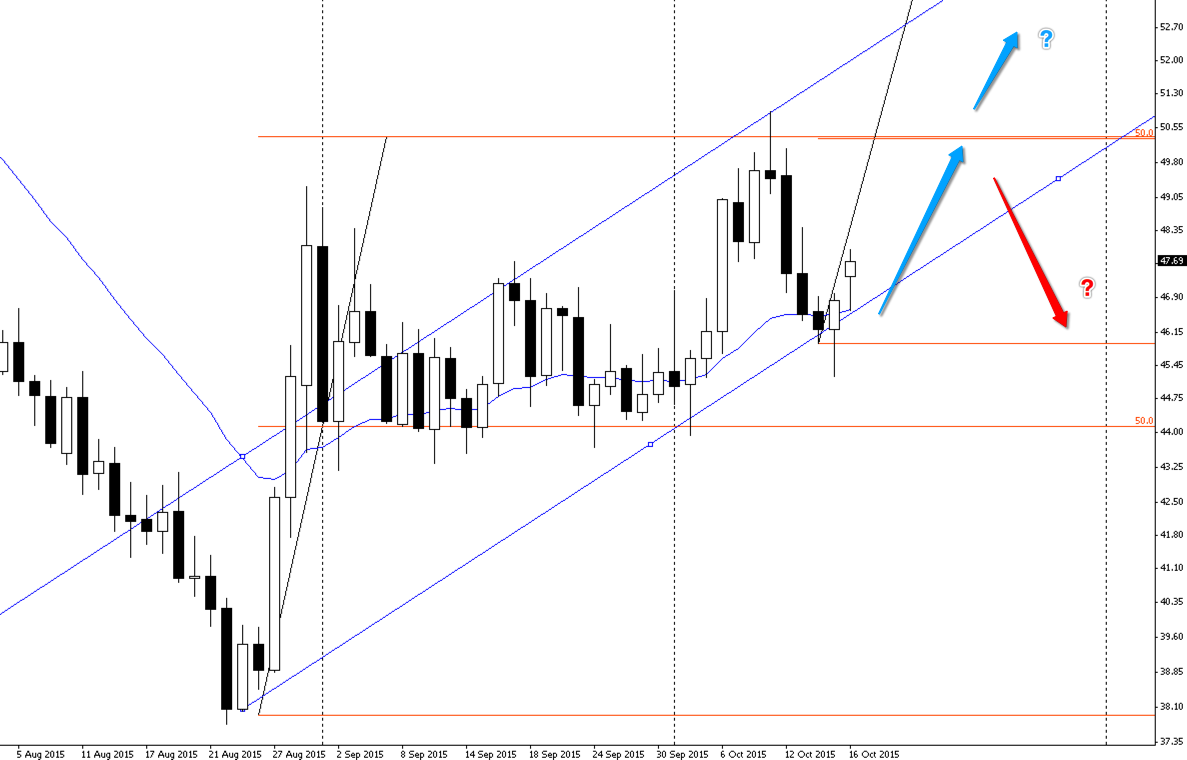
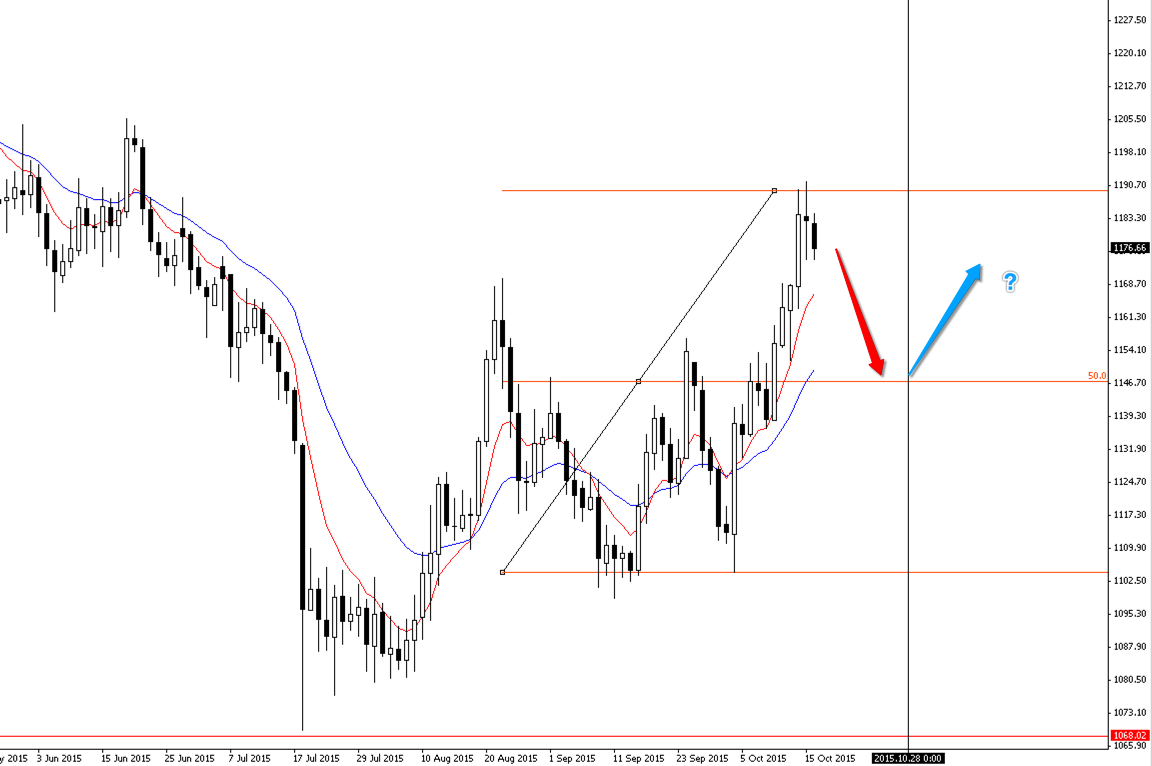
We can see that the market turned bullish and went long in what seems to be three pushes (marked on the chart). After three thrusts the market often reverses. For me, the market was always in long after the first push, and I looked for opportunities to get long.

At this point, a novice trader, influenced by the prior two-day bear market, and not focused at the moment, would be entering short at the top of both push 1 and push 2 hoping for a resumption of the bear.

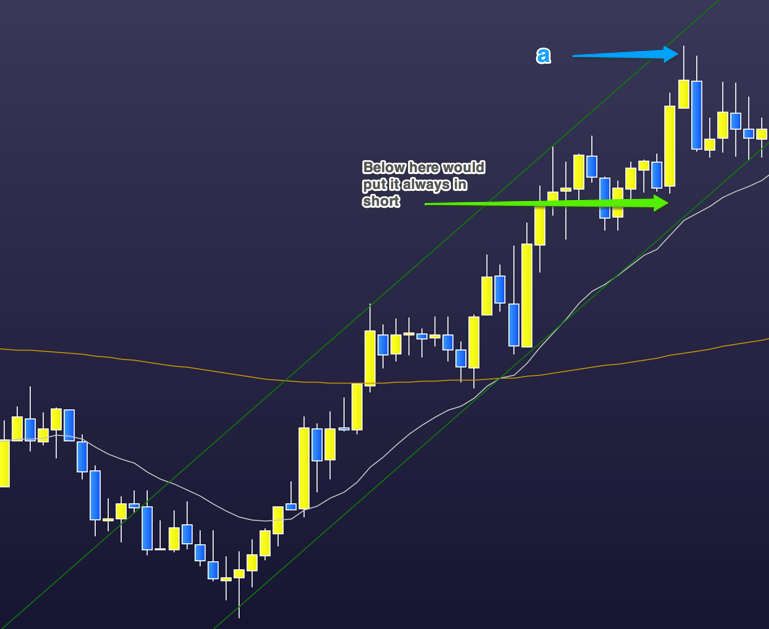
I exited my long at the blue arrow marked ‘a’. Choosing the exact exit from my long position was, of course, fortuitous. I thought, correctly this time, that price may reverse early and before the price could hit the green channel line which I’ve drawn.

However, price did not pull back as expected and at the yellow circle, which I’ve marked on the chart, I re-entered long. I exited that long, at a measured distance of the previous leg, for a reasonable additional profit; this turned out to be a ‘final flag’ long.

Reading the chart correctly, with the whole chart available, always seems obvious. However, reading bar by bar in a live trade is another thing altogether.

We are wary about entering long because of the steep bear trend on the higher time frame chart; and, to continue long when the bars are in the top right-hand corner of our screen, provides its psychological block.

To trade, as in this example, is often counter-intuitive. Whether we use price action, indicators or a combination of both we can only make a profit if we trade by (expert) rules and not by emotion and intuition.

Keep it simple and adapt

We are up 30% since the start and 21% so far this year.

snip20160924_2

Over my holidays I read all eight trading books by Laurentiu Damir. Seven of which are short e-books written about four years ago. He teaches simple, conservative trades. His more recent book ‘Price Action Breakdown’ provides a useful trading concept.

Laurentiu recommends the higher timeframe charts – such as 4-hour or daily charts; this, as he explains, is because of the effect that multiple news events throughout most days has on the lower (such as 5 minutes) time frame charts.

Laurentiu teaches reading a chart that is a time frame appropriately above your price action chart. For example, He would take the ‘bigger picture’ from the daily chart but use the 4-hour chart for price action set-ups.

We use (and I think Laurentiu does too) the 30-minute chart for the market cycle and the 5-minute chart for our price action – and we keep an eye on the news events that can affect us.

As Laurentiu explains: the thing with trading is that all of this is a guide. Flexibility based on a solid concept is vital. It may be the 1-hour chart but on the day the 30-minute chart. Price action may be 5-minutes, but again the 15-minute or even the 3-minute chart is prefered. It’s whatever fits.

We cannot trade by numbers and be successful, we have to know and understand a lot and, of course, practise a lot – then keep it simple and adapt.