Tag: daily charts

  • A bigger list needs a higher timeframe

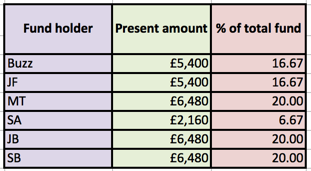
    Traded on behalf of friends and family, the ‘slow trader’ fund has taken on a few changes over its time. We have achieved a gain of over 15% a year, reasonable but short of my ambition for the fund. Over 30% a year is acceptable. We had ventured into equities, taken on the commodities and, more recently, we mixed with the currency markets. Yet, what is more important is the system by which we trade. That is the area that has seen the biggest change. And rightly so, these things don’t develop overnight. Therefore it’s not so much the ‘what’ but more about the ‘how’. The how is already in our ‘how we trade’ page. This page gives a glimpse only and is meaningless to anyone that is not a price action trader, and even ‘they’ differ wildly in approach. It is understanding charts through context, set-ups and price action. And it works.

    My own trading time has been delayed over the last 12 months as James and I traded very small for many hours a day learning the ropes of this form of trading. Pop-in a major renovation of our family business and, well no excuses, but time goes. Moreover, I trade three accounts. A small account for grandchildren, a payment account and the slow trader fund. I trade the grand kids account at the beginning of the month until I achieve the return I’m after and then do the same with the payment account. Only then do I move onto the fund. This may or may not leave much of the month left for the fund. This is not making best use of our trading time. Being only so many trading hours in the day.  The best way to provide more trading time for the fund is to trade a higher timeframe. Obvious, but I didn’t want the distraction of this as I was developing and remodeling my price action system.

    Currently we trade a 5-minute chart and on one item. This provides several trades a day on average. I scale-in on some of the trades which increases entries but, nonetheless, is essentially within the umbrella of one trade. If we trade the fund on a higher time frame – a daily chart being our most sensible option – then we will need more items to trade. Price action can trade anything. Using daily charts our in-trade duration would be a few days to the extreme of a few weeks. Equities would require the consideration of annual results and other business calendar events. I’m therefore favouring a commodity, S&P and currency trading list. As follows:

    snip20161214_2

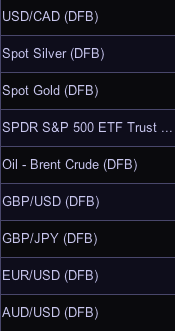
    These provide us with enough items to give ample trading opportunities from a daily perspective. More importantly, through this higher chart we are not jostling for trading time with the other accounts. Our risk, probability and reward criteria will not change. I think we are ready for this, and look forward to its introduction at the start of the New Year, 2017.

    Merry Christmas and a happy (which for us means prosperous) New Year

  • Monthly Slow Trader Fund update – 5th December 2015

    Slow Trader Fund is up by a total of 8%. Here’s individual positions:

    Snip20151205_29

    You may recall from recent posts that I’m spending more time developing day-trading abilities. That is: trading from the 5 minute chart.

    Slow Trader is a daily chart fund. This has not changed.

    However, development of day trading technique will be of great benefit to the fund.

    That is because price action in each time frame is similar. Trade management, trade frequency, assessment time and pressure are different.

    Trading in the 5 minute chart demands a constant (all day usually) watch of the chart. My style is to watch only one chart when in the 5 minutes. And from this one chart there are usually many opportunities in the day to trade.

    In contrast, far fewer opportunities are available for trades from the daily chart. Therefore, usually a number of different (daily) charts can be analysed.

    A successful day trader (and I mean the 5 minute chart, as the one minute chart is intense and draws a trader down the path of extreme scalping rather than – my prefered – trades which are broad scalps and swings) can profitably trade the daily charts.

    The same is not true in reverse.

    The benefits for the fund in my being able to trade the 5 minute charts is exponential.

    The New Year goal for the Slow Trader Fund is growth at a monthly rate of 5% to 10%. Ambitious but, I think, doable.

    Next fund update is 6th February.

  • Slow Trader Diary – week 38

    First diary post after being away for some three weeks.

    We are 2% up overall. The only trade left open while I was away was gold. And, although we are still open in gold, its current position nudges us into the positive.

    Let’s review: A while back, October last year, as you know, we took a double hit when the market dropped and then dropped again against all indicators.

    This brought me to change my trading technique. I went from indicator based to price action based. How to best explain these? Indicator based is like painting with numbers; it’s never going to be independent but is generally steady. Price action is blank canvas stuff.

    To get good at price action is like the artist. It doesn’t happen overnight. There is a lot of effort and practise put in along the way. But, as with the results of an artist over a paint with numbers person, the results can be outstanding.

    Lets do some sums:  if we start with £100 and gain £2 that’s obviously £102, a 2% gain.

    The simple mathematical issue with losing money however is this: if we start with £100 and lose half (50%), making our new amount £50, then to get back to our original figure of £100 we need a 100% increase.

    To be clear, if we lose 50% we need to do 100% to get back to the start.

    Sorry for the oversimplification, but I feel that we all forget about the importance of not losing money (particularly when trading or investing) because of the doubling effect shown above.

    And that is what I have had to do with price action since October. Where a 2% increase for the investor is unexciting, for me, the trader, it has been because I’ve had to nurture the fund up with a large increase to get back to the beginning.

    I love the price action way. So much so I managed to get about 50 hours of price action concentrated practise done through dedicated modules while I was away. That’s the the same as a pilot having to do time in a simulator. It’s necessary.

    I continue to run the fund primarily with daily signals reported weekly.

    Of note, I have three separate funds: a small fund for the grand kids (something most of you are looking towards slow trader to do) which I use weekly charts for; Slow Trader fund with which I use daily charts; and, a personal day trade account with which I use 5 minute charts.

    Price action works the same on all charts regardless of the time frame. I would not have more than one fund account on the same timeframe, too confusing and with intraday (day trading) is absolutely necessary. But separated this way they work well together.

    Next post: what makes it investing, trading or gambling?