A detailed record of each trade, in some form or another, is vitally important in trading, particularly in day trading.
That may include a written journal or a video recording. Whichever works best for us. But I think it has to be detailed, brutally honest and easily referable.
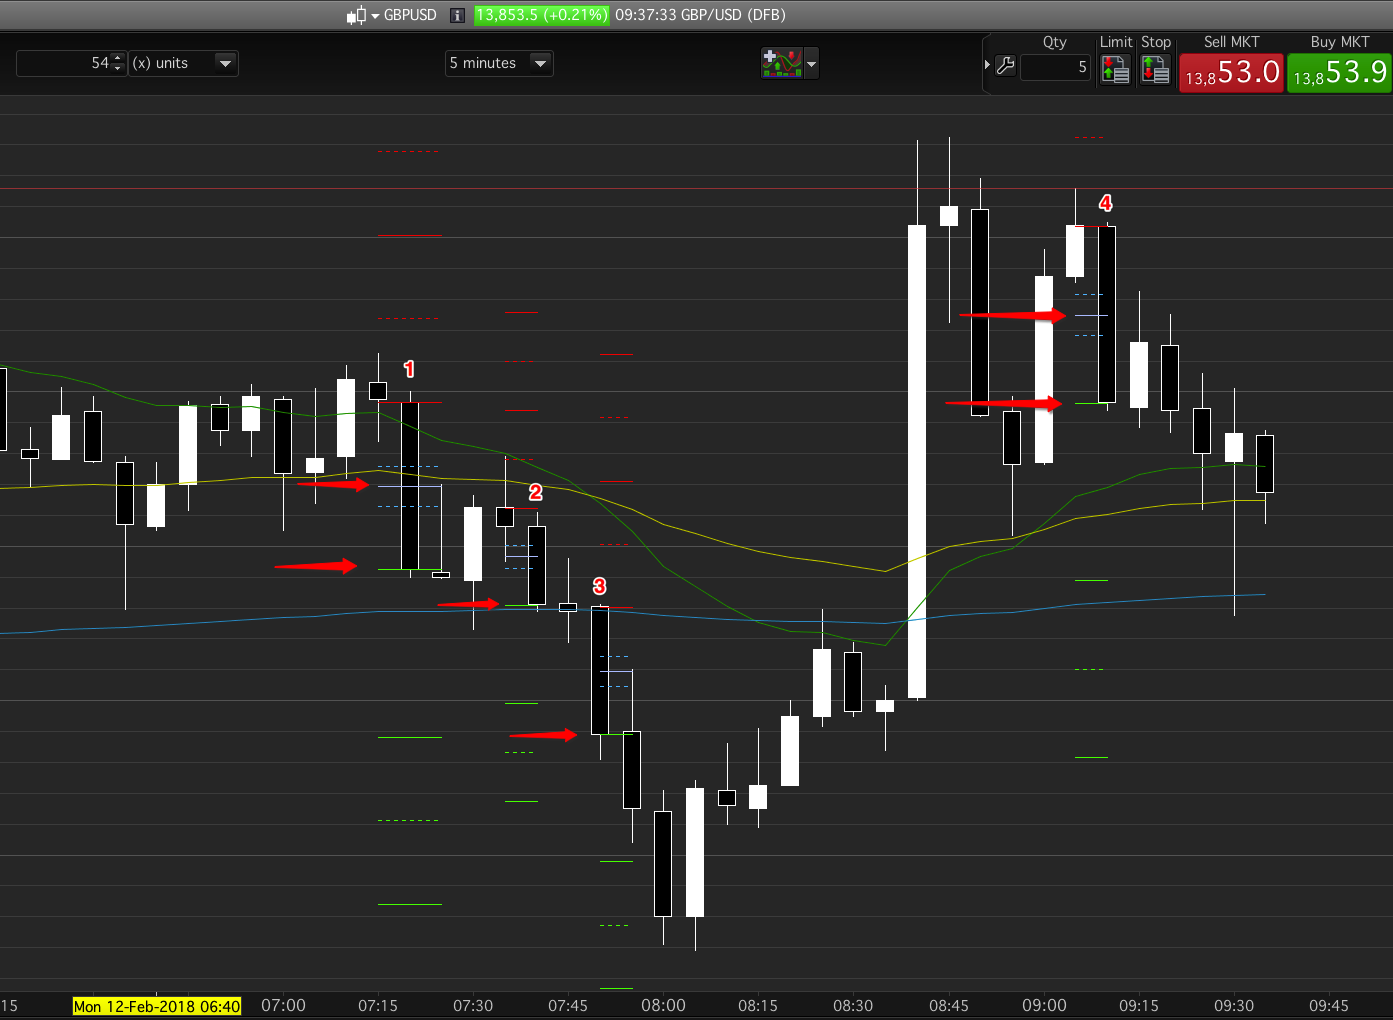
It is important to be able to match a relative chart to a written description too. One picture and a thousand words and all that!
Not only that, but extrapolating necessary data to provide trends is vital. For example, knowing that most winners come from trades with breaking news, or within a certain stock price range, or with a certain setup would be well worth knowing.
Previously, I have used a data software known as Tradervue. It is excellent and well supported. However, I’m now looking for very specific historical data comparisons which I can only achieve with a purpose-built system. Fortunately, I know someone who can do that for me.
I would also like to match a 10-second timeframe chart with my trade; current paid software will only support as low as a one-minute timeframe.
Also, I like a handwritten (unusual these days, I know) record of my trade rather than a typed one. I prefer written over a video simply for the ability to rapidly review the trade lessons, a video review being ponderously slower.
For anyone interested, I have attached below a (typed!) record of the trades I took over part of last month as I reported them, warts and all. I don’t use a template at the moment; however, each trade will start with a sector and record of the stock’s float and session volume at the time of the trade entry.
All trades are buy-only with a cash account, no leverage.
I don’t provide the stock’s ticker, as that didn’t transfer over easily and I don’t think it is relevant to the lessons learnt.
How to detail one’s lessons is very much an individual thing, and mine is always a work in progress. Even over the few trades detailed, I have refined my trading technique.
The trade descriptions below are most recent to oldest.
Bioprint. Float 5M, volume 16M. Breaking news.
Setup: Momentum above the 200SMA; waited for a mini PB below $3 and entered as the price went through the same level again.
However, price did not hold.
Held too long. As price went below VWAP, my stop of $2.20 (as I’d failed to exit at a more acceptable level) was the level I couldn’t let price go below, so I sold.
As soon as I exited, price gradually climbed back to my entry level of $3.
Overall, the entry was extremely weak, and I had no clear volume (and therefore momentum) showing on the tape.
AI technology. Float: 1M, volume: 21.3M.
No breaking news was showing to me at the time.
Price rose quickly and exceeded VWAP at $3.50.
High today was $4. My entry would be a break above the $4 level, with a mini PB, entering on the rise.
I got that with a fill at $4.19.
Previous day highs provided possible resistance up to $6, and thereafter the 50 SMA at $26.
However, price stalled at entry with minor PBs and retries.
I exited at $4.11 for an 8-cent-per-share loss.
After ten minutes, price went to $4.5 then $5, but without a convincing setup.
A reasonably managed trade.
My comment is that I spent too much time observing the chart rather than the tape.
Medical devices. Float 2.2M, volume 12.9M.
No breaking news. Chart volume is good.
At $0.89, the stock is below my usual level. $2-$7 is ideal. (The at-or-below-the-dollar level is usually too volatile, but this stock seemed very steady.)
The price was above the 50 SMA, and I had a target of the 200 SMA at $1.69. Another resistance was yesterday’s prior high of $1.27.
The tape stayed favourable throughout the trade, moving through the $1 buffer and pushing up to $1.14, with $1.10 forming a lower-timeframe resistance.
The tape suggested the $1.10 level would not hold, so I sold, achieving a fill at $1.09.
Price then moved back to VWAP at $1.01 before gently climbing again to $1.20 and the high of the day.
(Overall, I took 20 cents per share as a reasonable outcome—the shares were so cheap that I was able to buy more than I would otherwise do with a higher priced stock. However, at or near the $1 level can come with extreme volatility, so it is not a stock I would normally buy).
Biotech. Float: 1M, volume: 2.3M.
Setup: No breaking news at the time. Momentum breaks from $2.3 to above $3 in less than 2 minutes.
A 10-sec PB and a continuation above the VWAP.
Volume was reasonable. A possible target was $4 and the 50 SMA.
Got filled at $3.03; however, the price stalled and started to decrease as more support for the offers emerged.
I took my exit at $2.87. A late exit, influenced by having committed my shares for the day and hoping for a resurgence.
The exit at $2.84 was in no man’s land with no clear stop. Therefore, not holding $3 would have been a better, less costly outcome.
After a few minutes, price attacked the $3 level again, then fell back to $2.40 and on much reduced volume.
Skincare. Float 5.6M, volume 6M. Bought at $1.36
Minutes-old news of a merger.
Setup: Mini PB to just below VWAP. Entered on a break above the mini pullback trendline and as price touched VWAP.
Potential target was the 50 SMA at $1.82. However, as the price progressed, it climbed to $1.42 on the Offer within about a minute, then hesitated.
My new considered exit was $1.50, slightly above the recent high.
However, over a few seconds, it became reasonably obvious that the price would pull back from the $1.42 level, with a high number on the offer side relative to the Bid.
I immediately sold and got filled at $1.41 for a 5-cent-per-share gain.
Correct decision, as the price pulled back to $1.25. The price then rose to $1.50 as expected, then sold off.
Overall, very happy with the decisions surrounding this trade. The only ignored part of this trade was the volume before I entered; on each of my timeframes, it indicated higher negative volume (red rather than green volume bars), which proved accurate in what subsequently happened.
Technology security. Float: 1.1M, volume: 3.3M. Relevant 2-minute-old news.
After a fast climb to $3.5, the stock had a sharp pullback to $3.00. A positive showing, then, at VWAP around $3.20.
I took the trade and got filled at $3.20.
A rapid increase in share price to $4. I sold and got filled at $3.78 as the price was fluctuating quite quickly.
More than a 50-cent profit, but my reason for an exit was weak.
The tape did not have anything unusual on the Offer, and no red was showing on the 10-second chart.
My exit was not backed up by anything other than some emotion.
Entry was 10 out of 10. It met all the criteria, with a difficult PA chart when the chart is in auto, with rapidly increasing volume.
Exit was a 3 out of ten. Three is awarded because the profit was reasonable, but where I gained 50 cents per share, $2.5 was comfortably possible.
Lessons: If nothing on the Offer and the chart is still good, stay in the trade.
(Side note: the chart perspective is improved in the 10-sec Heiken Ashi if I stop automatically fitting the data to the screen and set the price scale, sometimes nearly double the current price.)
AI-driven real estate. Float: 11M; volume: 61M.
Breaking news, excellent volume and nicely above VWAP.
No setup other than a break of the high at $1.50. Probably buying at a top.
Bought at $1.49, with potential to go to $5.
My mental stop was $1.25 (The low stop is a function of buying high on a push).
However, I revised the stop to not be below $1.53, which is the low of a small consolidation.
I sold as the $1.53 level was likely to break. The PB was only $1.50 ($1.48 on the chart), then zoomed higher without me.
Lesson: I was too quick to lock in a higher stop. The consolidation was too light to justify the decision.
Selling at $1.90 would have worked, and looking for a reentry after the next PB would have been ideal.
AI event platform for creators. Recent news. Float 14.5M, volume 17M, climbing rapidly.
Price is hovering just below the 50 SMA, but above VWAP. Recent history of price spiking through the 200 SMA, currently at $3.86.
Entry was an unsatisfactory break. A later break was better, and price then achieved the recent high of $2.80 in quick succession.
Needed a better setup and a willingness to hold through a certain amount of PB. (I won’t hold through a PB. I need a better setup.)
Medical devices. Float 2.3M, volume 54M.
Issue with the 200 SMA at $1.74, which it had already hit today.
However, I thought it would hit it again soon. I was correct; unfortunately, I’d already sold for a small loss.
I had gone back to the 10-sec chart, and that is what got me out.
From the 5-minute chart, I probably would not have taken the entry.
The one-minute chart—maybe.
Same lesson as yesterday, reinforced. The 10-second chart is excellent in debrief but a hindrance during the actual trade.
Better to assess the higher timeframes, such as the 5-minute chart and maybe the 0ne minute, but no lower. That gives me time to take in the tape better.
Medical technology. Float 3M, volume 70M.
Ownership good. Recent breaking news. (Traded—unusually—after the open).
Potential was priced at $3.50.
The setup was a break above $3.00, which it did very quickly, reaching $3.20. Micro PB and an entry on an active signal. (i.e price increasing above the PB high).
Got filled at $3.21.
Price stayed in a micro range, then zoomed to $3.44. It started to PB, and I got my sell fill at $3.36.
After my exit, the price pulled back to $3.06. At which point it created another buy signal at about $3.29, then consolidated in a tight range around $3.50.
Price gradually pulled back to below VWAP at $3.00.
Overall, a reasonable trade and a couple of learnt adjustments:
- The follow-on trades were clearly visible on the 10-second chart, but the one-minute chart was clear enough and also provided better context.
- Keep the highest-timeframe chart at 1 minute.
- The ten-second chart distracts from the tape.
- The main reference is the 5-minute chart, with the one-minute as a confirmation only.
- I found that using the 5-minute as the main focus gets me onto the tape early and forces me to follow the tape reaction better.
America’s Car-Mart. Float 7.3M, volume 17M.
Setup was a break of a 10-sec trend line (TL). The TL also showed, although not as well, on the one-minute chart.
The break was also through $4.50, which, along with whole dollar levels, is a resistance level in itself.
Bought at $4.42, and the price moved quickly to $4.63. After which, I wasn’t seeing follow-through on the tape, and a PB seemed likely.
Not wanting to risk going negative, I sold (filled at $4.44).
After a minute, the price fell below the entry TL and, over the next couple of minutes, continued to £3.25.
My only reservations about the trade were the company’s purpose, the float size being slightly large relative to volume, and the lack of breaking news.
Overall, a good entry with a positive exit when it was reasonable to assume the trade was not going to work as desired.
Biotech. Float 4.6M, volume 9.2M.
A DIC trade and a loss. (DIC is short for predictive).
Tried to front run a possible short squeeze.
Went against PA, and nothing is sure on the tape either.
These are not suitable trades for me. DIC or front running.
Entered at $4.59 with a possibility of getting to $6.
Out at $4.43 and $4.55 should have been my exit.
Hospitality trust. Float 2.9M, volume 8M.
Weak ownership but recent news release.
Entry was a PB above VWAP, with a high number on the Offer (or was it the Bid?).
Price progresses steadily through $2.30.
I was too quick to take a sell. Nothing drastic on the tape or the chart. Was using a 5-minute chart, now trying a 2-minute instead.
Biotech company. Float 16.6M, volume 3M.
The float is too high, and the volume is relatively low.
However, after a recent big sell-off and news, it got my interest.
A change in charts now has me using only the 8-hour, 4-hour, one-hour, and five-minute charts.
The change forces me to study the tape more closely rather than be distracted by particularly low-time-frame charts.
It worked in this instance, and also in my watch of recent stocks—definitely more time with the tape.
I anticipated a sell price of $4 with an entry of $3. Actual entry was $3.12.
Resistance at a very recent high of $3.50 had me reconsider, and I took the opportunity when it soon presented itself.
It was correct: a high of £3.70 occurred, but then it pulled back to VWAP and below my entry price.
Better to take the profit and wait for another entry opportunity if it comes.
See previous (below) trade for details.
Second entry.
Setup: Break of resistance, a prior high from my earlier trade at $1.70.
Filled at $1.75. The tape showed the break, with a minor PB, and price reestablished upward.
Of note, a lower fill, say near $1.70, would have been possible, but that would then have been a DIC (preDICtive) trade.
Again, price stalled, and I sold on a PB to the $1.70 level. Price pushed again to $1.80, then pulled back to below resistance.
A deeper stop-level would, in this case, have worked okay, as the price continued to see small, uncertain rallies.
However, I was satisfied with the management.
That is my second and final attempt at this stock for today.
Payroll group. Float 1.4M, volume 9.6M. One-minute volume and MACD are good.
No apparent news, but the price is rising quickly.
After a VWAP break and a micro PB, I bought.
Got a slightly high entry at $2.35; the price rapidly went to $2.49 (my exit would have been $2.50).
A small PB, and I expected a pushback to, and maybe above, $2.5.
However, as the price pulled back further, I took the sell without hesitating. I got out at $2.41, providing a small profit.
Overall, a well-executed and managed trade. The PB was last seen at $1.50, which took only a few minutes after my exit.
Footnote: the 200 SMA was at $2.74 and a recent previous rejection level; hence, my only ambition was to achieve a sell at about or slightly above $2.50. I looked at getting in at $2.30 ($2.35 was the buy, as the price was moving so quickly at the time), with an exit at better than $2.50, providing at least a 20-cent target profit or an 8% to 10% profit on the trade. The 20 cents does not sound like a lot, but convert that to a nearly ten per cent gain in a few seconds, then it’s acceptable.
Digital holding company. Float 5.4K, volume 32.5M.
Setup was an extended 10-second PB break.
Price stalled and then dropped around the $14 level.
My exit was at $13.65 as I held to see if I could get more.
Need to work more closely with the tape, particularly when in.
Overall, however, a reasonably well-executed and managed trade.
AI drone warfare integration: Float 22M, volume 1.5M.
The float-to-volume should have been a red flag. I missed it.
Setup. Too sharp a PB below VWAP and a single non-engulfing 10-second bar back to VWAP; I entered before the close.
A small profit and an exit due to the tape hesitating. Exit was a good call, but the setup and the float-to-volume were poor to no trade.
Lesson. Watch out for getting too glued to the 10-sec chart before the entry decision.
Social media holding company. Float 2.6M, volume 42M.
Three setups have already been seen since 12 o’clock.
I took the fourth setup, probably a ‘B’ entry, as below the previous low.
As such, the price stalled to climb away. Took my exit at a loss, which was correct, even though the price soon zoomed to nearly $5.
Biotech. Float 1M, volume 1M.
Share split active.
The price is rising quickly from $3 to $4.
I bought it for $4.21. The 10-sec chart then showed a PB to $3.8, followed by a rise to just below $4.5. I looked to exit at $4.5 but only managed $4.30.
A mini PB (viewed on the ‘tape’ and not the 10-sec chart) would have provided an acceptable setup; however, the result would have been similar.
Volume dropped, and price weakened.
Technology. Float 6.6M, volume 2M.
The float and volume are the wrong way round. However, immediate quarterly results and a rapid push to the 50 SMA.
As yesterday, I saw a large number of offers on the tape, but it was slow to sell. Two or three seconds later, the price dropped.
I then—rabbit in the headlights—held a bit too long, hoping for a bounce that was not going to come. I exited a moment later.
The difficulty was the 50 SMA. I have to question whether, given the 50 SMA, this was a trade for me.
Medical. Float 6M, volume 1M.
The float/volume is a red flag.
Overly influenced by weak news and a rising price. No setup worth noting.
I saw the high Offer on the tape and didn’t immediately exit.
Paid the price (actually 10 cents).
Overall, poor and not what I’ve been doing.
Manufactures infrared-sensor systems: Float 830K, volume 3M.
Set up a minor trend break at VWAP.
No reported news on TV.
Chart volume and MACD are fine.
Higher-priced entry due to insufficient funds to enter on touch keys and late on standard order entry.
Initially, it looked good, but a rapid PB to the VWAP and at the entry trend line would have justified an exit.
However, I held my breath, and the price zoomed a whole dollar from $9 to $10.
Because of the rapid PB that briefly put me in the negative, I took a reasonable exit at the half-dollar with a small profit.
Okay, in hindsight, holding to $10 was better, but the result and trading sense were sound.
Price rose to $10.5 before gradually falling, with volume declining and the MACD crossing into negative territory, dropping back to $9.
Diagnostic tests. Float 1M, volume 33M. Chart volume is reducing; MACD is weak but okay.
Recent high at $8.5; therefore, a possible target.
Entered at $6.18 with a minor trend break and a PB to VWAP.
Chart volume was my only concern, but that could build rapidly.
It started reasonably well, with minor resistance at $6.33.
However, chart volume stayed low, and the ‘tape’ was light.
My exit (recent lesson) would have been a negative break of the minor entry trend.
It got close but rebounded long back to the entry price. Chart volume remained weak, so I sold at BE.
A weak entry due to chart volume; however, the trade plan was sound and resulted in an acceptable result.
(Of note, price continued its slow descent but did not fall below the entry trend line. At market open, the price moved to nearly $7 when last observed).
Early-stage cancer therapy. Float 16M, volume 32M. No news. Entry was $2.81 with an exit at $2.61.
Chart volume is low; MACD is early green and has crossed.
No adequate setup other than price rising.
After entry went positive for a brief moment, before a PB and below what should have been my exit.
Holding too long because I only had the one trade available to me. (Not a recipe for successful, consistent trading).
However, the price at $2.31 reversed, broke a minor trend at $2.6, and showed tentative positivity.
Lesson. Wait for a setup!
Construction, float 740K, volume 13.5M.
Missed the first buy signal at $9. Left the next at just over $11 due to the high price for me and how far above VWAP it was.
The next signal came at the break of a minor trend line at $10.50. Looking for a 50-cent gain.
Got the entry at the exact price and held for a few minutes while it hesitated.
Things I’d missed:
MACD remained unfavourable, and volume was down.
I had not extended the trend line to provide a better sell signal if the price descended below.
I just picked a selling price that would result in a 20-cent loss. The exit ended up being 25 cents below.
Price then quickly went to my imagined exit of over $11.
Good lessons from this trade. It was a suitable setup, but had negative entry indications.
Exit lesson. If I ignore the negative indicators for a moment, the exit on a break of the entry setup is better going forward. It can result in the occasional larger loss, but it helps prevent repeated small losses and exit guesses.
Holding company, Hong Kong; news not evident; float 320K; volume 6M.
Strong buying from about $3 up to $8 in a few minutes.
Good opportunity on minor PB to enter during the £3 to £8 climb.
I held off on entry because the profile, particularly ownership, was heavily weighted toward closely held shares.
However, a PB from $8 to VWAP at about $6 had a break of a minor trend line and a good entry opportunity, at least for a 50-cent gain.
I took the entry (in as price went through $6.50, with an actual entry at $6.63) and took the exit without hesitation at $7 (actual exit $7.09).
Price made $7.50, which matched weak PA on the 10-sec chart. However, it was fleeting, and if I’d held for that, I might not have filled.
Price immediately rejected and descended to $5.
Overall, a well-executed and weighted trade amid difficult but lively price movement.