Tag: trend

  • Market cycle

    With my previous styles of trading I had some great years, and the occasional shocker.

    The great years were linked to trending years, that’s where the market consistently moves in one direction.

    However, the market spends about 80% of the time in a trading range. This is where the market bounces up and down, seemingly erratically, between levels.

    A trending strategy, used when the market cycle is in a trading range, does not work.

    The market cycle of trend and trading range is evident in all timeframes.

    Understanding the market cycle, and applying a strategy for the part of the cycle that we are in, is the first key to consistent profitable trading, or more accurately the control of losses.

    Some traders will trade many markets and watch for one to provide the cycle that they prefer. Momentum traders are an example.

    Other traders, like us at present, watch one market (or a few) and have strategies to trade that market no matter what its cycle.

    It does not matter which method is used. What is important is understanding the market cycle and using the appropriate trading strategy.

    That understanding, I have to say from personal experience, is the only time the ‘shocker’ can be eliminated.

  • Slow Trader Diary – week 31

    Here are our cashed-in trades for week 31: Healthcare Partners Inc + £89, GBP/USD + £687

    IG is our broker, costs for the week were – £25.17

    Lets take a look at GBP/USD.

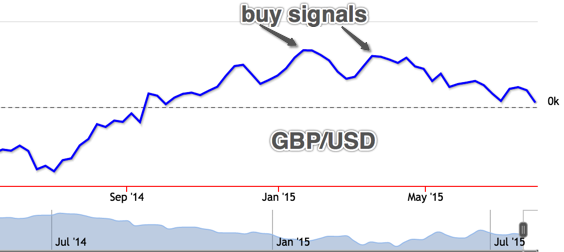
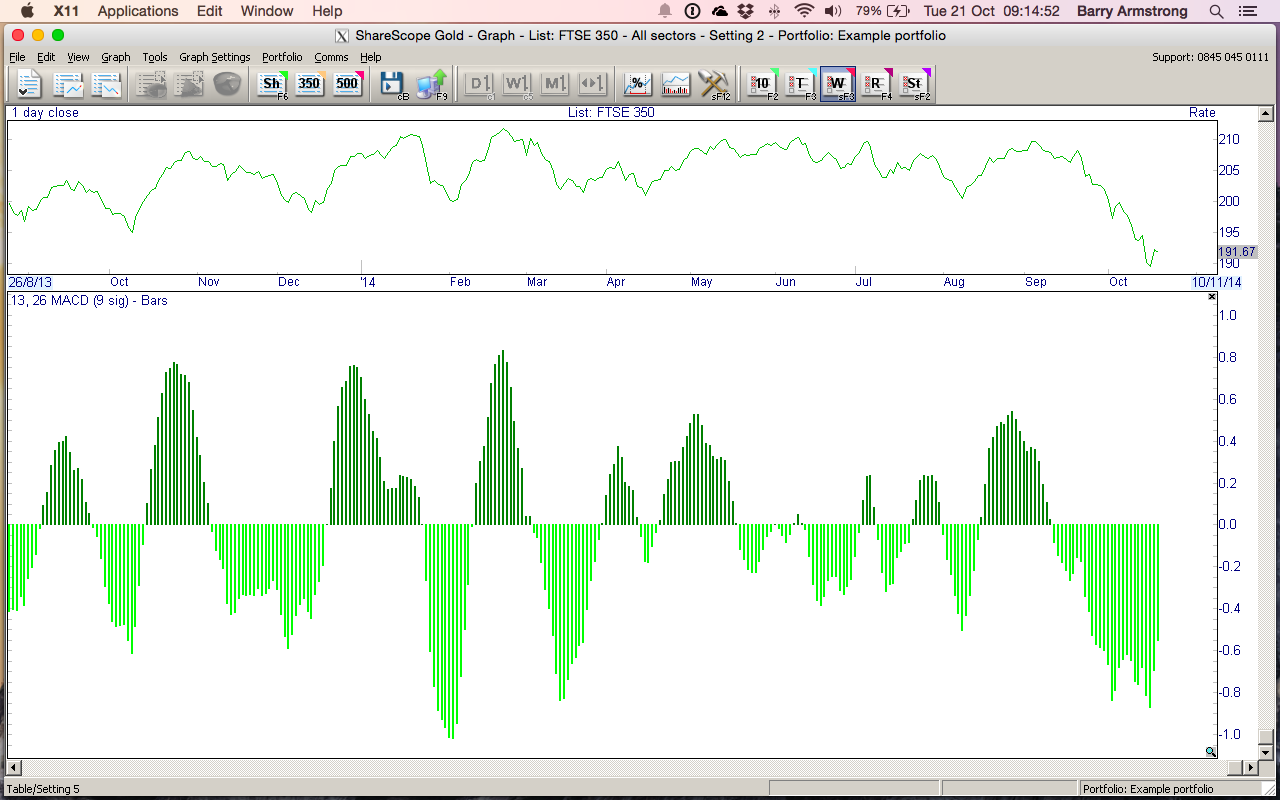
    Conditional: this is a graphed COT (commitment of traders) report giving us a buy condition.

    Snip20150801_2

    This graph represents several months so gives us the condition only, important as that is. From left to right, the first arrow is against the trend. Therefore we would not take that as a positive buy opportunity. However, the second arrow, and second buy indication, is good as it is with the recent trend. The buy condition should remain if the blue line on the chart continues to descend to a new low.

    The COT report is completed for the previous week on the following Tuesday and is published on Friday. It is therefore about two weeks old by the time we get it. However, it is like the oil tanker analogy where you move the rudder but it takes several miles to turn. Often that is the case with the COT. Even though it is old information it gives us a solid hint at the conditional.

    Once we have the conditional we need a matching recent trend. I’ll talk more on the (elusive) trend in follow up blogs.

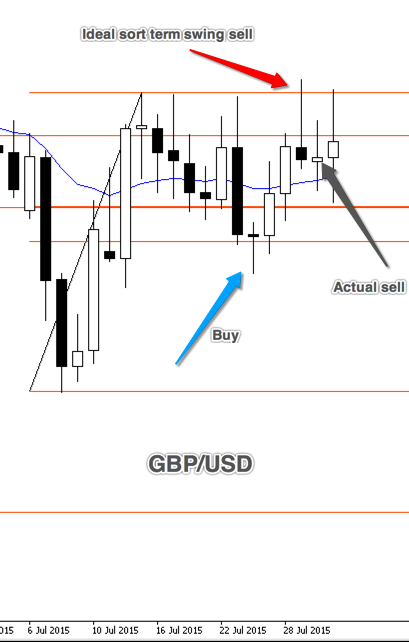
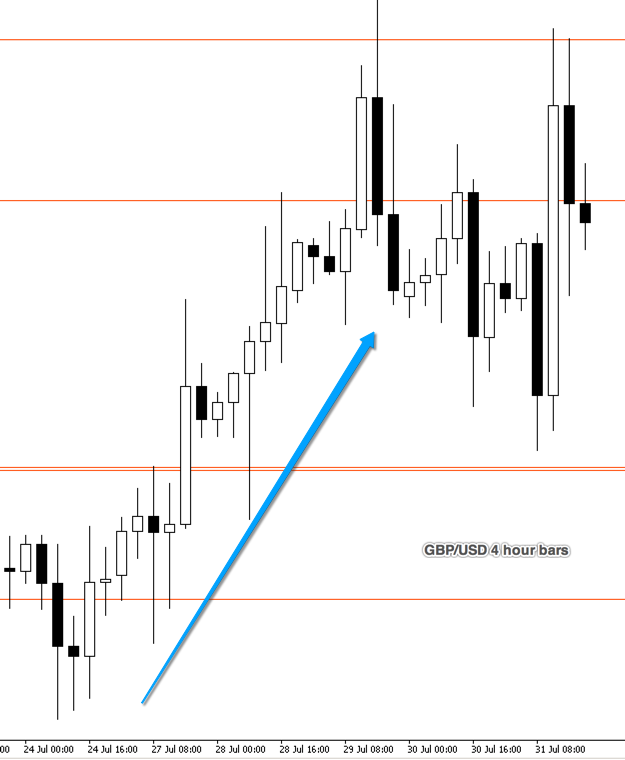
    After trend we concentrate on price – in other words a buy signal. Here is our buy signal for GBP/USD this week. The first graph is in daily bars and the second is the same trade from bottom to top but in 4-hour bars. The second chart gives us a different view as to the dynamic of the trade.

    Snip20150801_3Snip20150801_4

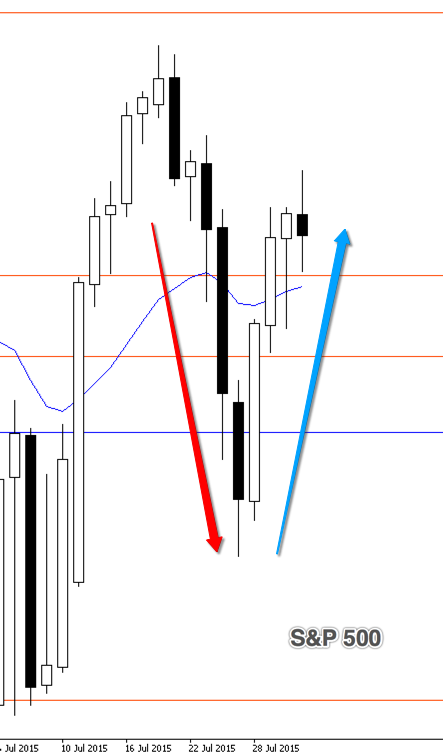
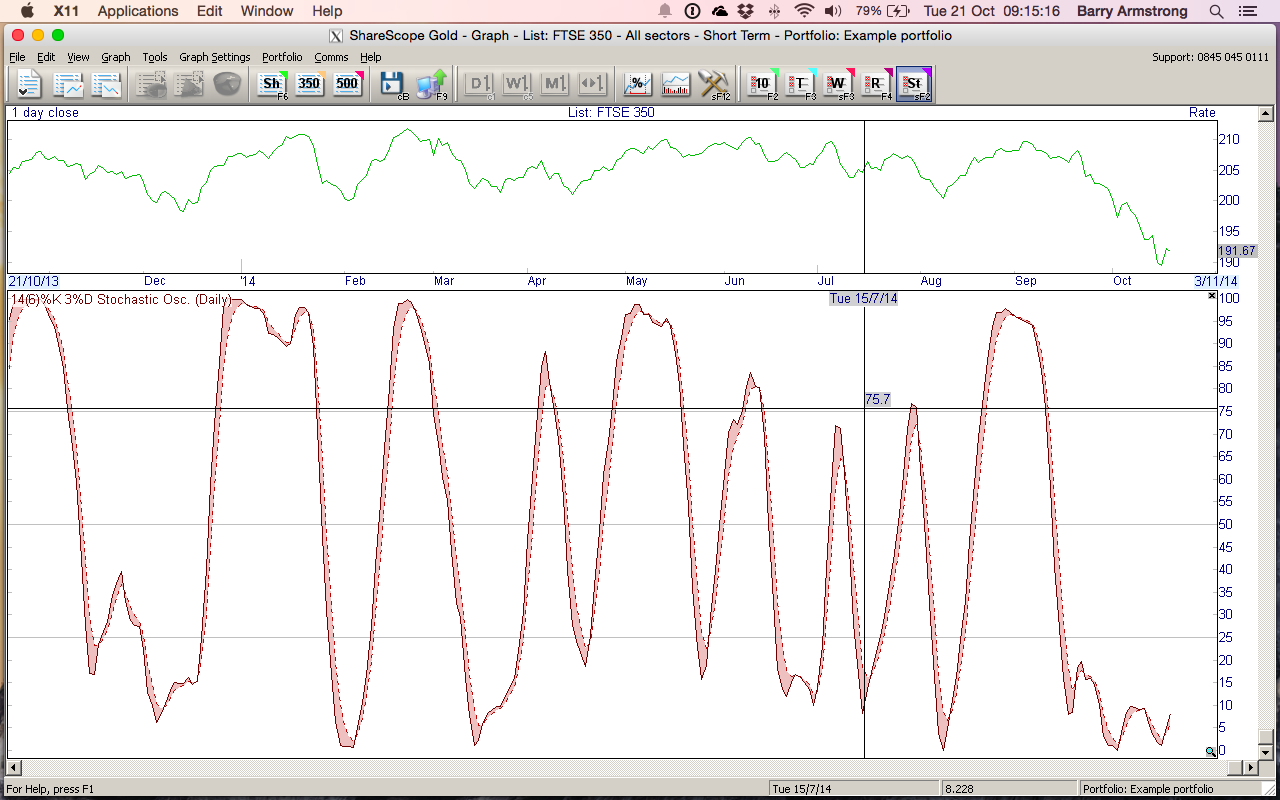
    Moving on. You may have noticed the S&P. Here it is today:

    Snip20150801_7

    Knowing what the S&P is doing is not a trading conditional for individual stocks (or shares in the case of the FTSE). That would be too broad a statement. Interestingly, the movement however of the S&P was more or less mirrored by the stocks on my short list. Even being confident of the future movement of my selected stocks I still missed most of them. ‘How is this possible, B’? I hear you say.

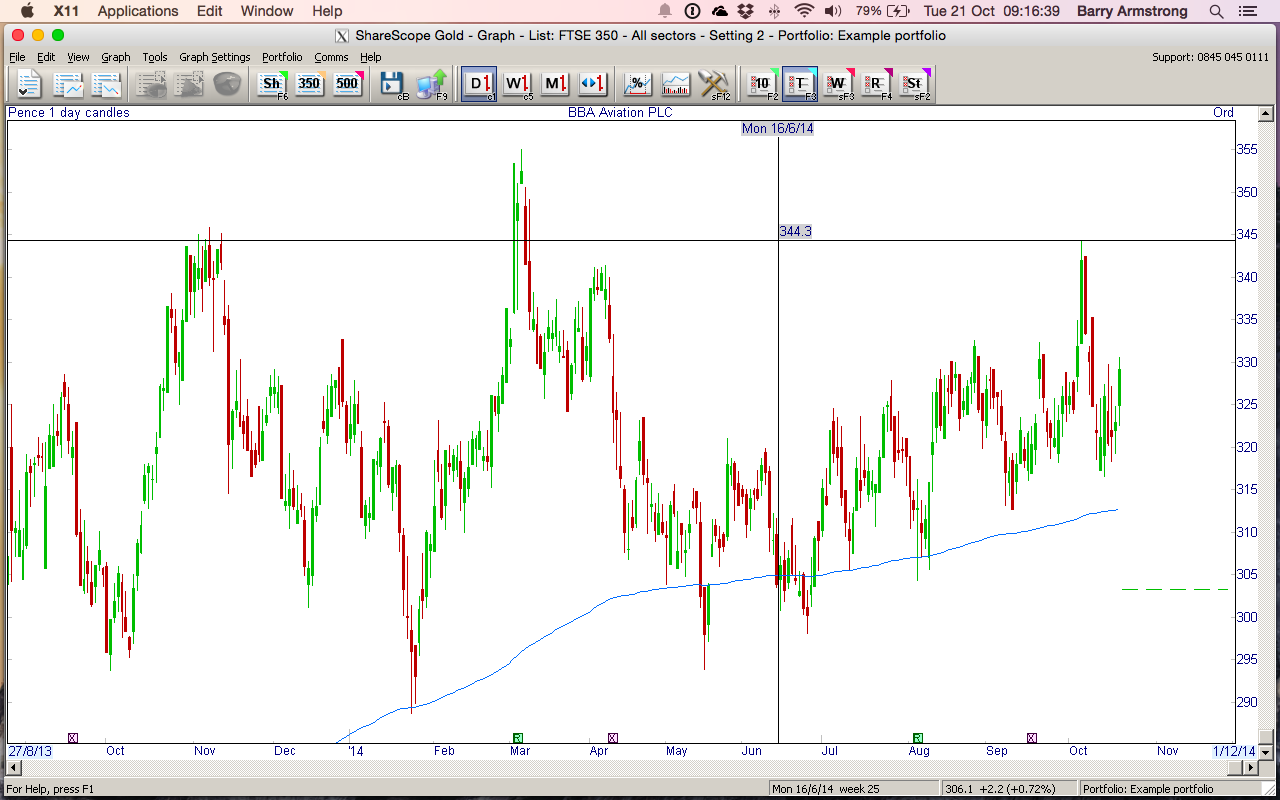
    This is an example of what happened.

    Snip20150801_8

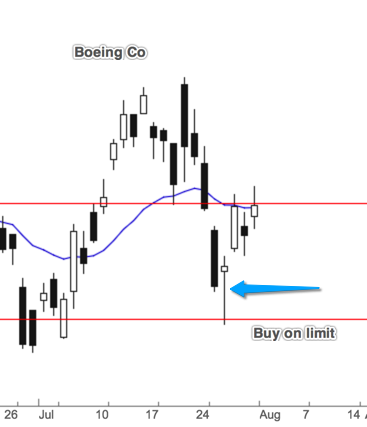
    This is Boeing, We notice by the date that the bottom (blue arrow) coincides with the predicted bottom of the S&P. This pin, at a 50% retrace, is a great buy signal. (Again, we will cover price in more detail in future blogs for those that are interested).

    If we choose to: buy on market, that is buy now at current price – or buy on stop, that is buy at a higher future price – or buy on limit, that is wait and buy at a lower price – is a judgment call. And one, on this occasion, I got wrong. You will notice that the bounce was so hard that after the pin the next days opening price gapped up. Only a buy on market would have worked. I went for buy on limit and missed it. “C’est la vie.”

    This was the same this week for four trades that I set.

    For the coming week we are keeping a sharp eye on gold. The commercials (that is the COT report) are warming up nicely to a buy signal. Beware of the trend however and remember, as well as recent trend, we also need price or more accurately price action. But more on this later.

  • Being conditional helps us win the pub quiz

    With the possible exception of day trading, all trades or investments follow a simple process:

    • Conditional
    • Trend
    • Price

    This applies no matter what my preferred method.

    Conditional is something that gives us a clue as to the probability of something happening in a defined way. In other words, its like taking a sneaky peak at an answer sheet before a pub quiz.

    Conditional can be any number of things. For example, our conditional could be as simple as knowing how popular a product is, or how well somewhere is managed, or we have a particular take on how to calculate a future value of a company, or we might have a particular talent in astrology!

    Whatever it is, we need something conditional to give us an advantage. Without it, with regards to the big picture, we’re guessing.

    I use different conditional guides for different items. For shares and stocks over the shorter term its consistent EPS (earnings per share) percentage growth over the past 10 years. Sounds complicated but is easy to obtain with most trading software.

    For longer term buys its future value, what Benjamin Graham coined Margin of Safety (MOS). I couple the MOS with consistency of growth.  If you’ve seen my early blogs this is difficult to do well. However, you would be daft to trade (invest) long term without it – or something that gives us a similarly advantageous condition. Maybe Nick, the author of the calculations I use, can provide this information on-line in the future.

    Also, a current favourite of mine in the medium term time frame for foreign exchange pairings (FX) and commodities is the COT (commitment of traders) report. A simple chart but one, I have learnt ,through lots of trial and error, that takes many consistent weeks and months to understand properly and use well.

    Ask yourself (or your fund manager) what ‘conditional’ you (fund manager) use. Are you happy with it. Does it work. Or are we guessing?

  • Finding the Trend

    Consistently finding the trend is possibly one of the most difficult things to do when trading.

    One idea is to use a single 260 day moving average. This represents about a year in trading days. If trading long then the lows of the chart for at least a week prior are to be above the 260 day moving average.

    However, only trade long when you have this together with your chosen market as a whole moving long. This is important and the opposite is true if trading short. The figure below shows the current FTSE 350 in MACD histogram weighted by cap. This market is tentatively moving long, i.e. moving into a tentative buy regime. I say tentative because of the shape and depth of the histogram.

    Screenshot 2014-10-21 09.14.55

    Together with the histogram, if trading long, the stochastic, or similar indicator, must show an over sold:

    Screenshot 2014-10-21 09.15.16


    Here are a few shares that currently meet the 260 day moving average criteria:

    Screenshot 2014-10-21 09.16.29

    Screenshot 2014-10-21 09.16.39Screenshot 2014-10-21 09.16.29


    The individual share must also meet the MACD and Stochastic requirements. As an added assurance, the calculated Margin of Safety is to be acceptable, depending on whether you are long or short.

    Happy trading

    B