You will probably have heard on the news that Sterling (GBP) spiked down massively.
This happened 5 minutes after midnight yesterday morning. The reason is speculated.
Technically, from a 50 year – or so – chart it is entirely expected for sterling to drop at this point. Indeed, we would consider a drop down to 1076, rather than 1118 that it did reach, appropriate. But it’s easy for the technical trader (or anyone) to say that after the event. And certainly it wouldn’t have been expected within a 2 minute period.
Here’s how it looked on a short-term chart for GBP USD.
Bars on a chart are normally represented relative to the biggest bar. Here we can see the 5-minute bar chart before the dip.
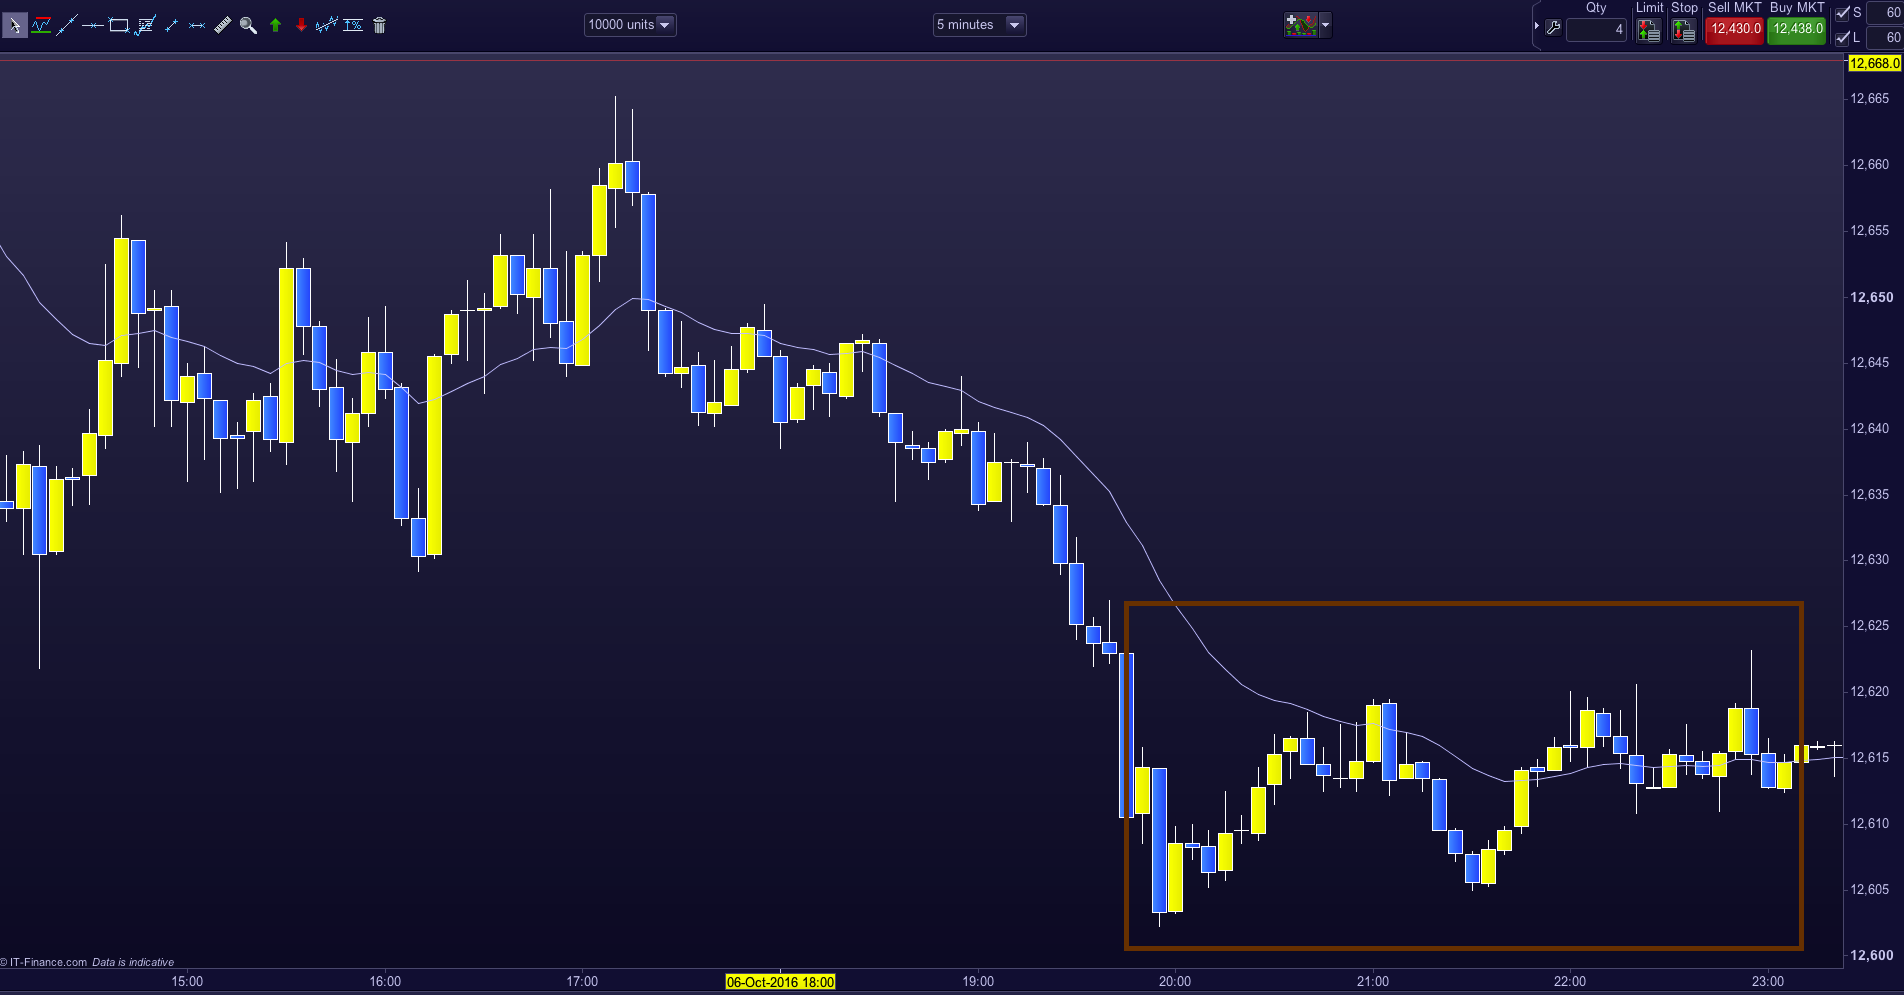
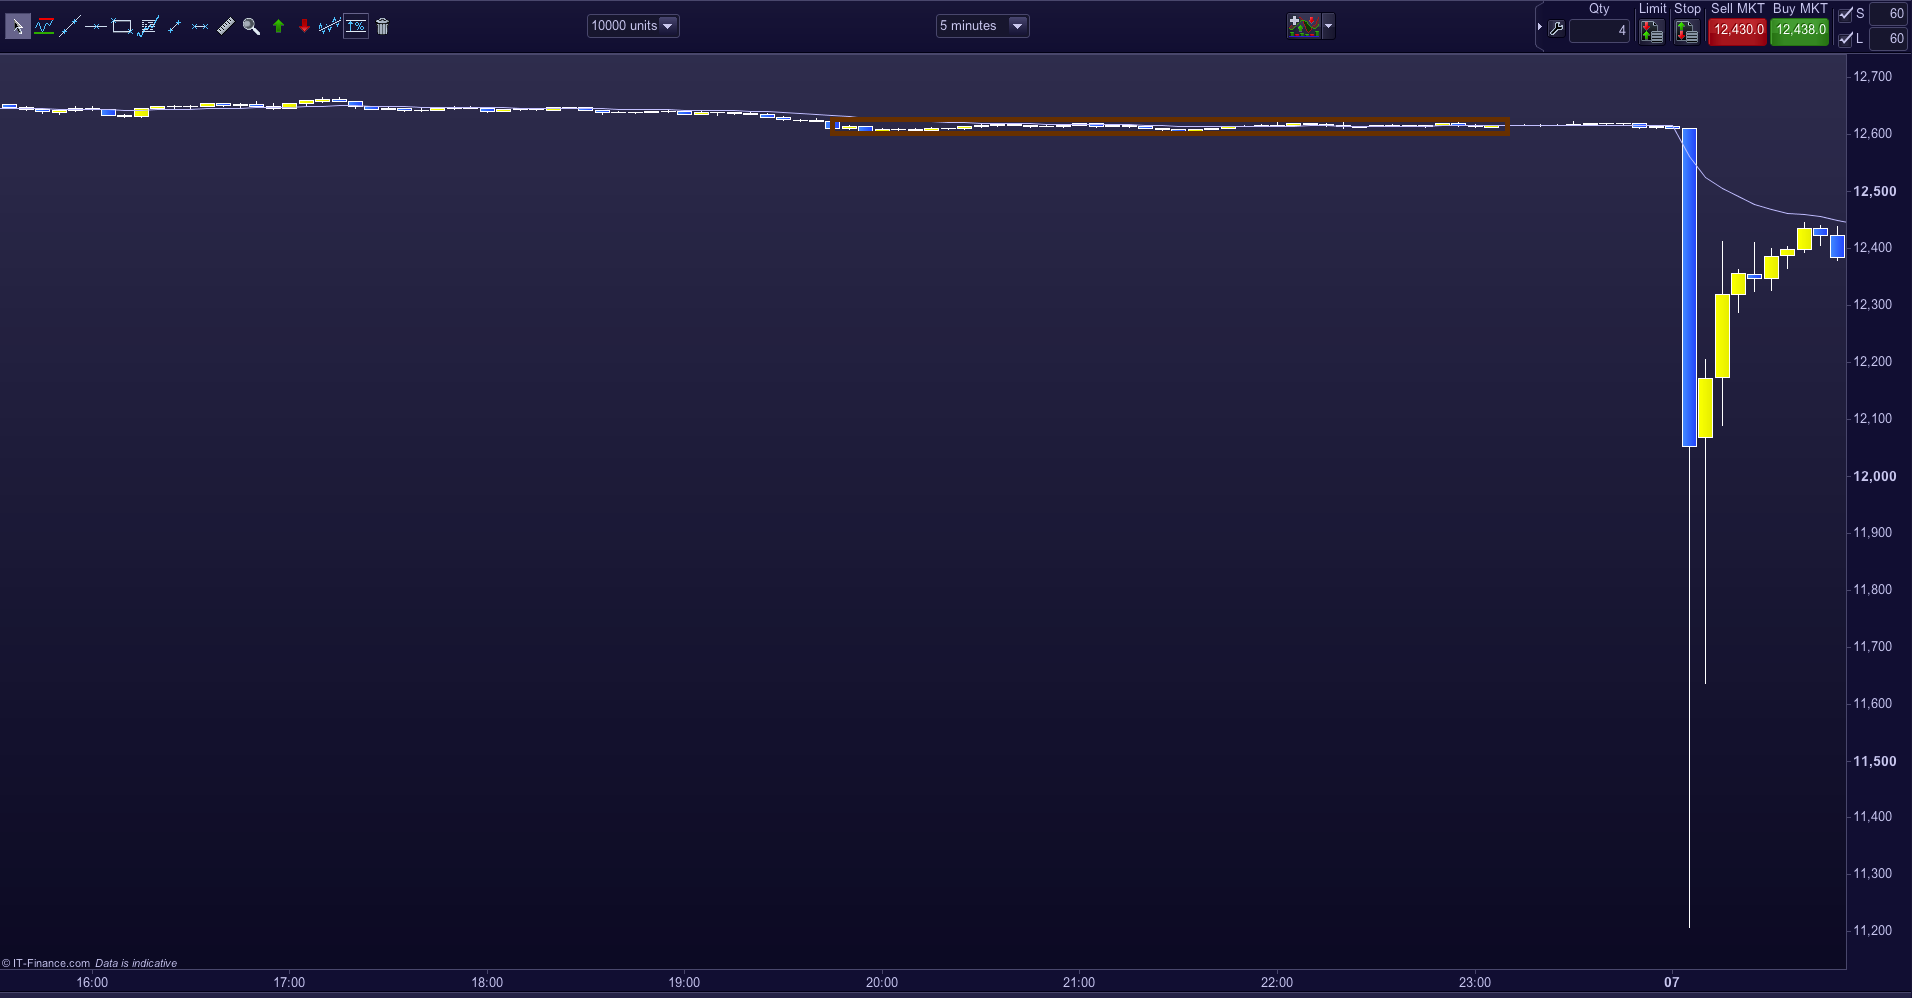
In contrast, here is the same chart moved forward in time by about an hour. The bars in the reddish box are the same bars on both charts – and provides an idea of how far the dip extended from the perspective of the short-term trader.
If a (competent) short-term trader were trading this chart at the time how would the trader have fared? Okay, I think. here’s why:
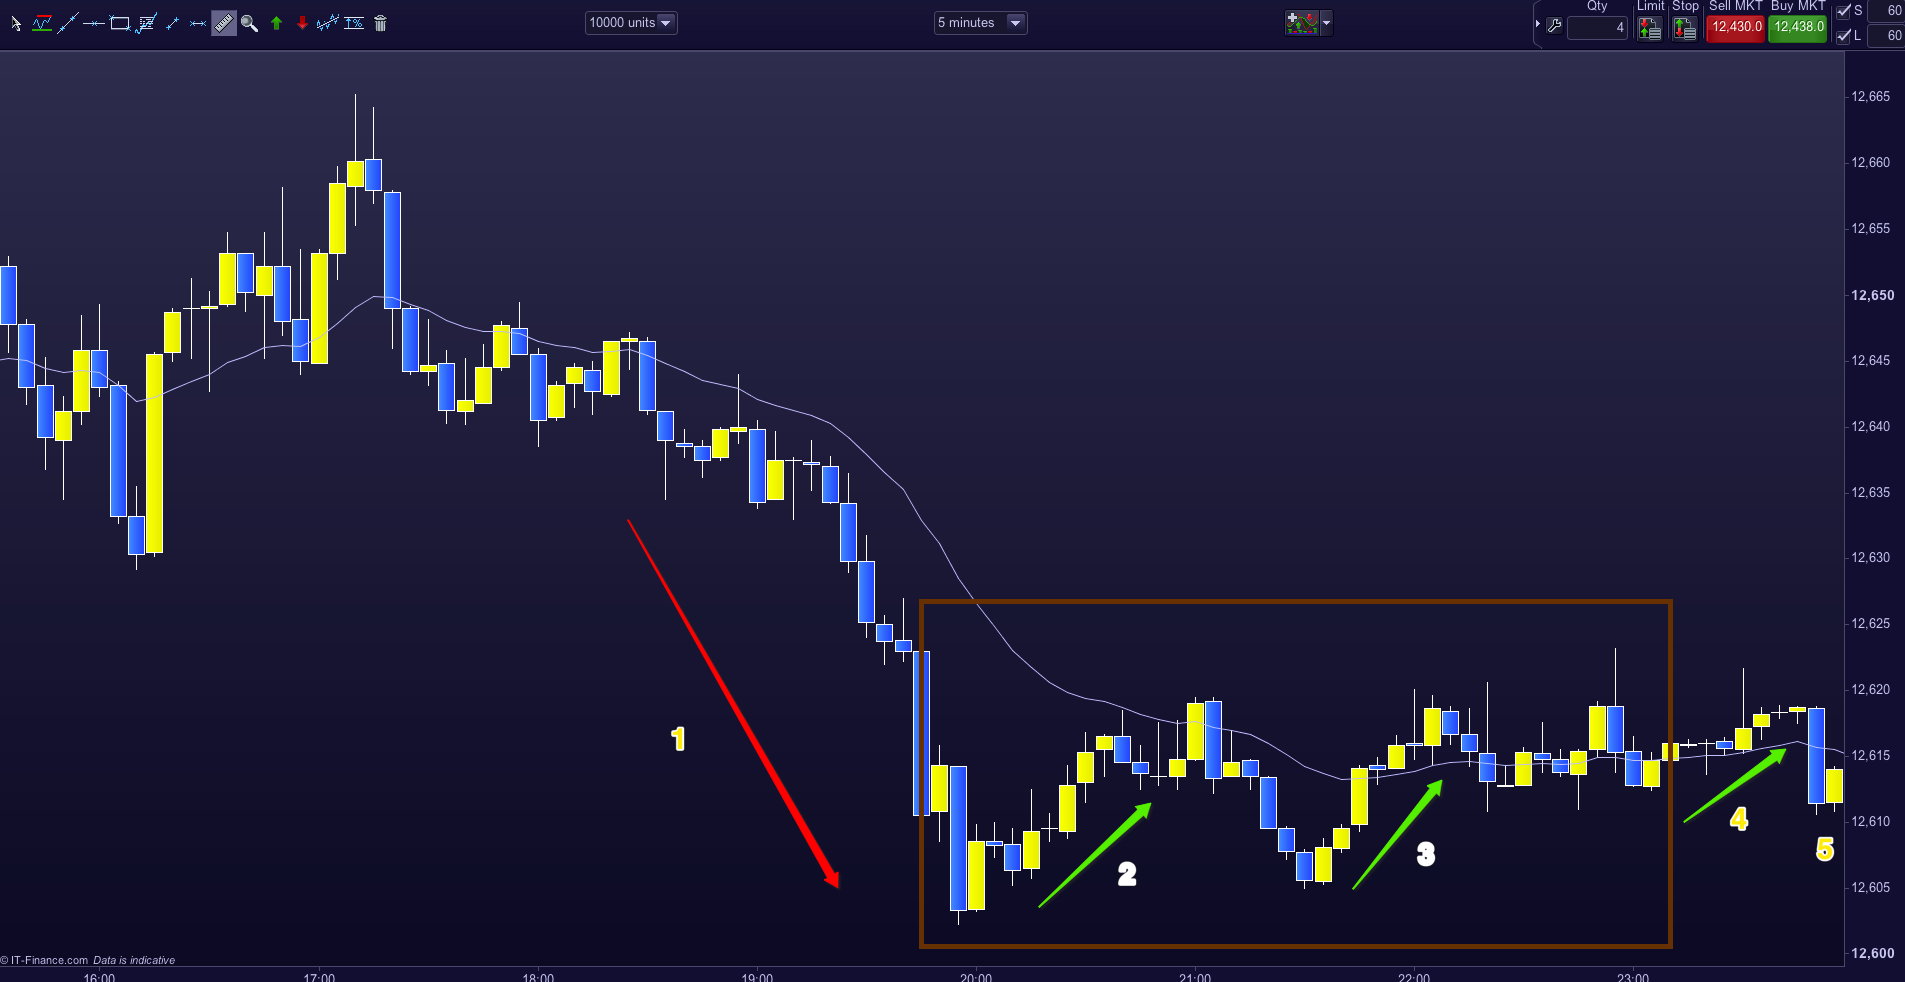
The red arrow (1) indicates a clear downtrend and therefore only shorts (price going down) should be considered. Without going into price action talk the green arrows 2, 3 and 4 show that any significant attempt at a pull back is weak. The blue bar (5) is a definite trend bar short, not least of which it closes strongly down and lower than the previous two dozen bars. I would enter short here, or more likely, because of prior price action, before bar 5 formed.
Ten minutes later price dropped 1,400 pips in 2 minutes. However, it’s all meaningless because if I had traded the drop I’d have made 30 pips (60 pips at the most) as short-term trading is precise and that is where my pre set target would have been.
