Difficult times in the trading business for the longer-term investor.
Wonderful opportunities for short-term swing traders, if we get it right.
I sat on the side lines as the markets slipped recently. Unable to take advantage of shorts (trading the market to go down) as it all happened so suddenly. The large dips in FX (foreign exchange pairings) occurred, in those I monitor, within a minute.
There are after shocks, so timing any recovery is interesting. Those that I will consider are:

Silver. At some point soon I consider Silver will rally, short term. However, recent Up (or recent trend) is against us so a buy to go up becomes an advanced move, meaning the buy signal needs to be clear.
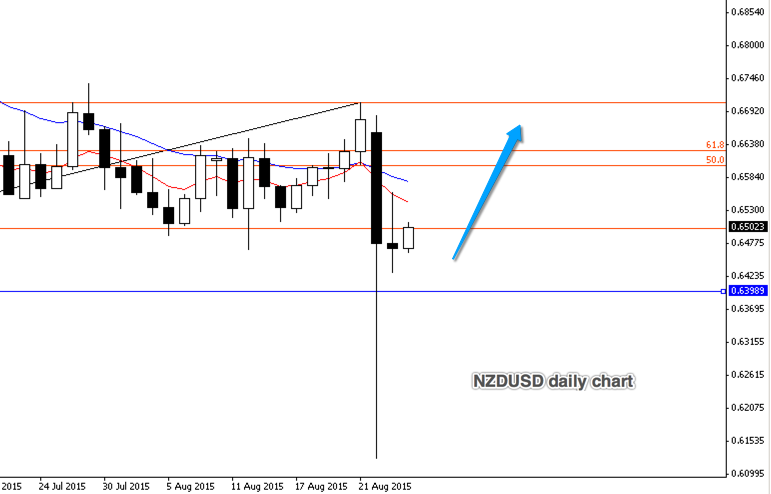
NZDUSD is firmly down on the long trend. The COT is a buy, but we have to be careful with the COT signals when the COT is going against the longer trend; the COT, in this instance, still often works but can be short lived. Having said that, there is a (possible) short term buy opportunity here.
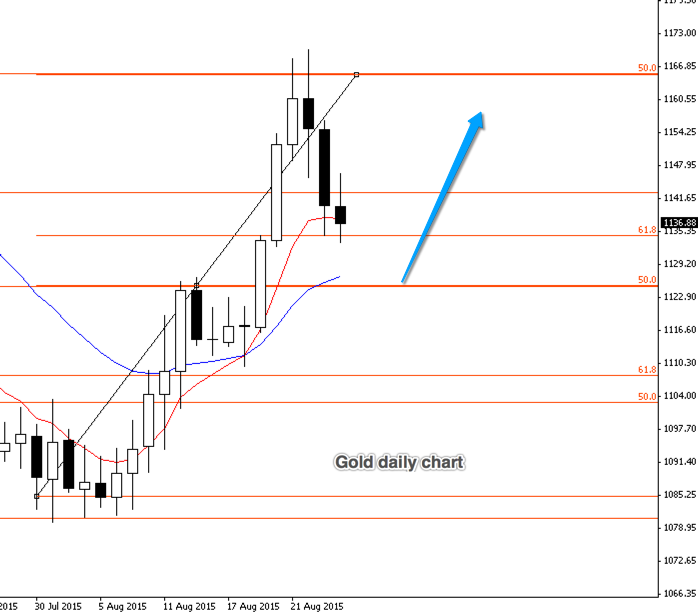
I’m looking for a buy in gold at about 1125 price with a good buy signal. Catching the signal with the correct buy: on-market, on-limit or on-stop is key.
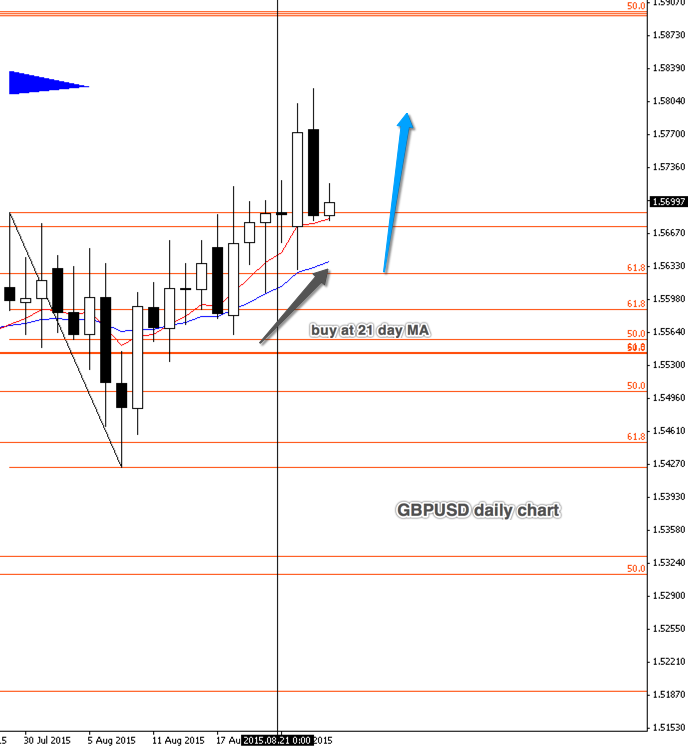
GBPUSD has been relatively stable over the last few days. A retrace to the 21-day moving average (MA) is worthy of consideration. It may happen quickly, if at all.
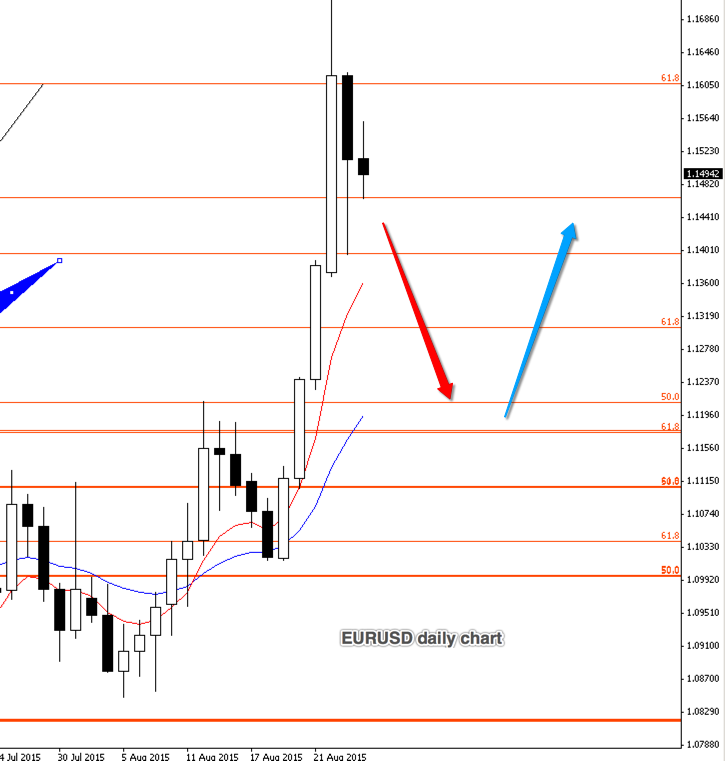
EUR might strengthen again soon against the USD. Unless I get (daily, or, at a pinch, 4-hour) price action at a support level I will not take this until about the 1120 level.
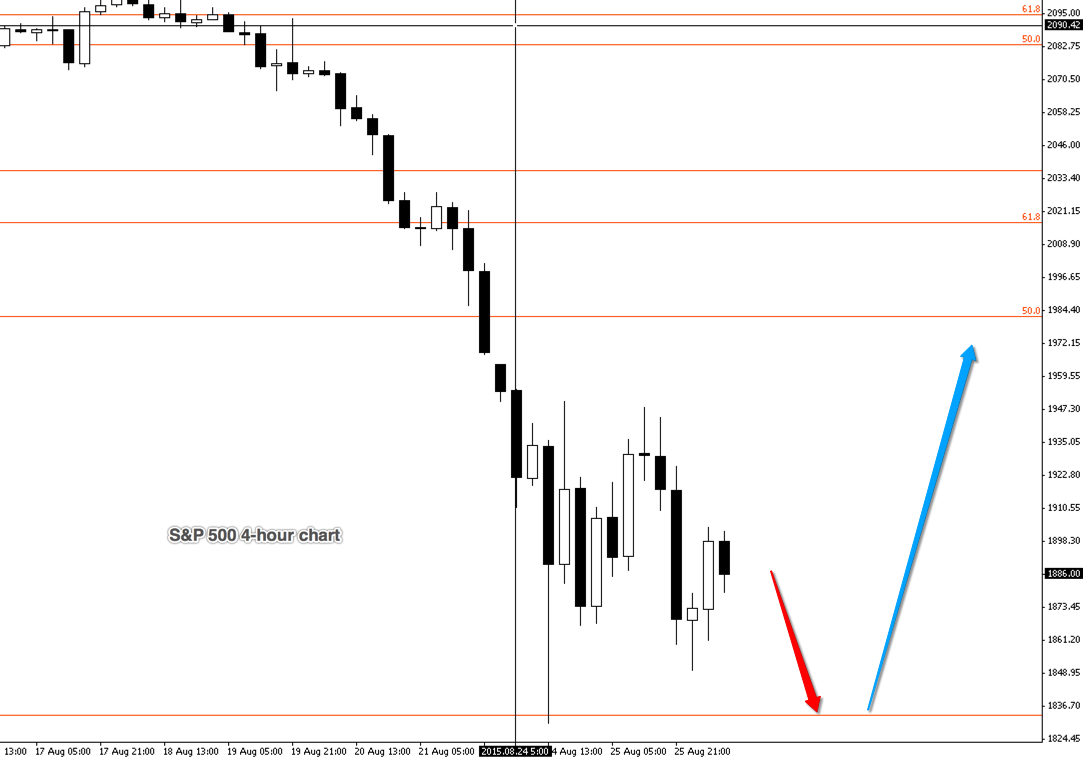
Finally, the S&P 500. This, I find, is possibly the most difficult to judge. With the recent dip the S&P could provide a good gain on a bounce. A buy in the region of 1836, but could go down further to the 1770 region. Good price action, or whatever is your chosen price criteria, is important here.
Lower trade values and generous stop positions are considerations when volatility is high.