Most are aware that I took losses at the end of Trump week. No blame to the US president-elect, the responsibility is all mine. Ironically, it came after my boastful ‘fulfilment’ blog. Hey-ho.
Losses always take ten times longer to make back. But they’re lessons we’ve paid for so we should heed them. To that end, the basics of what we do have not changed; however, entries and targets most certainly have changed.
We’re all familiar with the concept of risk and reward. However, we rarely consider the third equal partner – probability. In general, the smaller the risk the smaller the probability.
Therefore, we’ve increased managed risk but also increased probability by taking trades that meet our “always in” criteria. This is not simply trend but a trade taken with context in the direction of a trend bar that has broken a premise point.
Here’s an example from yesterday of what I mean:
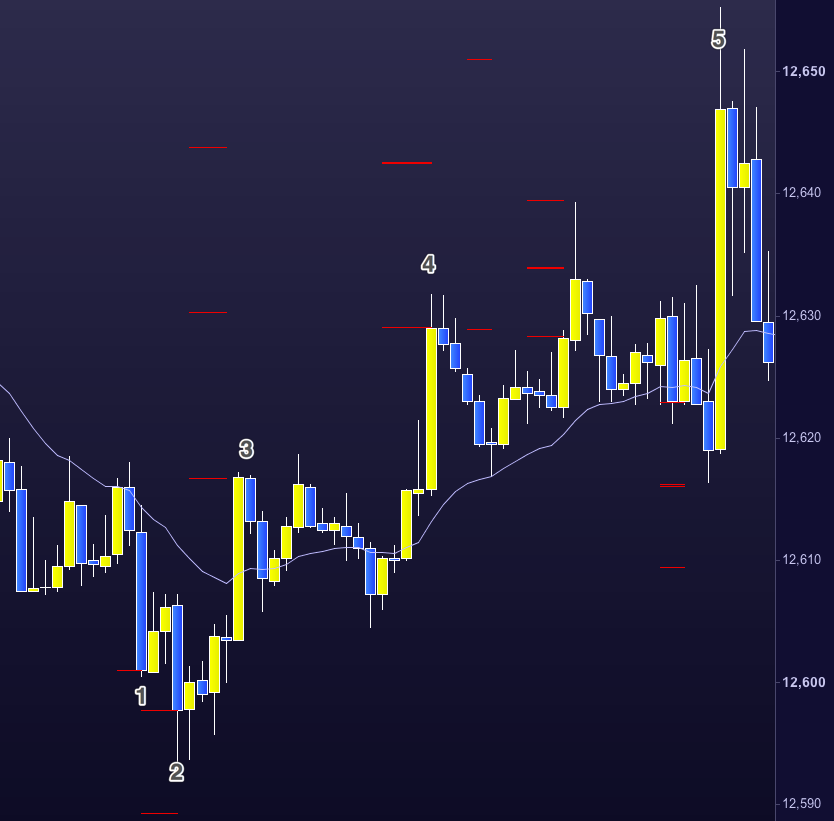
Left of frame is a down trend with a classic 3 push down. Three measured pushes usually means a reversal. Previously we’d be looking to take the bottom of bar number 1 long, as it’s the third leg down. However, bar number 2 was a ‘final flag’ or a final extension down. Our stop may have previously been set close below bar number 1. Thereby providing a low risk but also a low probability trade. In this example we’d have been stopped out at bar number 2.
We now, as we did yesterday, enter the trade long at the top of bar number 3. This is arguably a higher risk but higher probability entry. We can see that this bar has also closed above a line of premise. Meaning above the previous high bars to the left.
The red dashes are my measured targets. My target was close to the top of bar number 5. However, in this instance I came out earlier as bar number 5 was a news based US monthly non-farm payroll announcement – and they can be quite another thing.