Tag: Margin of Safety

  • Is it time to worry?

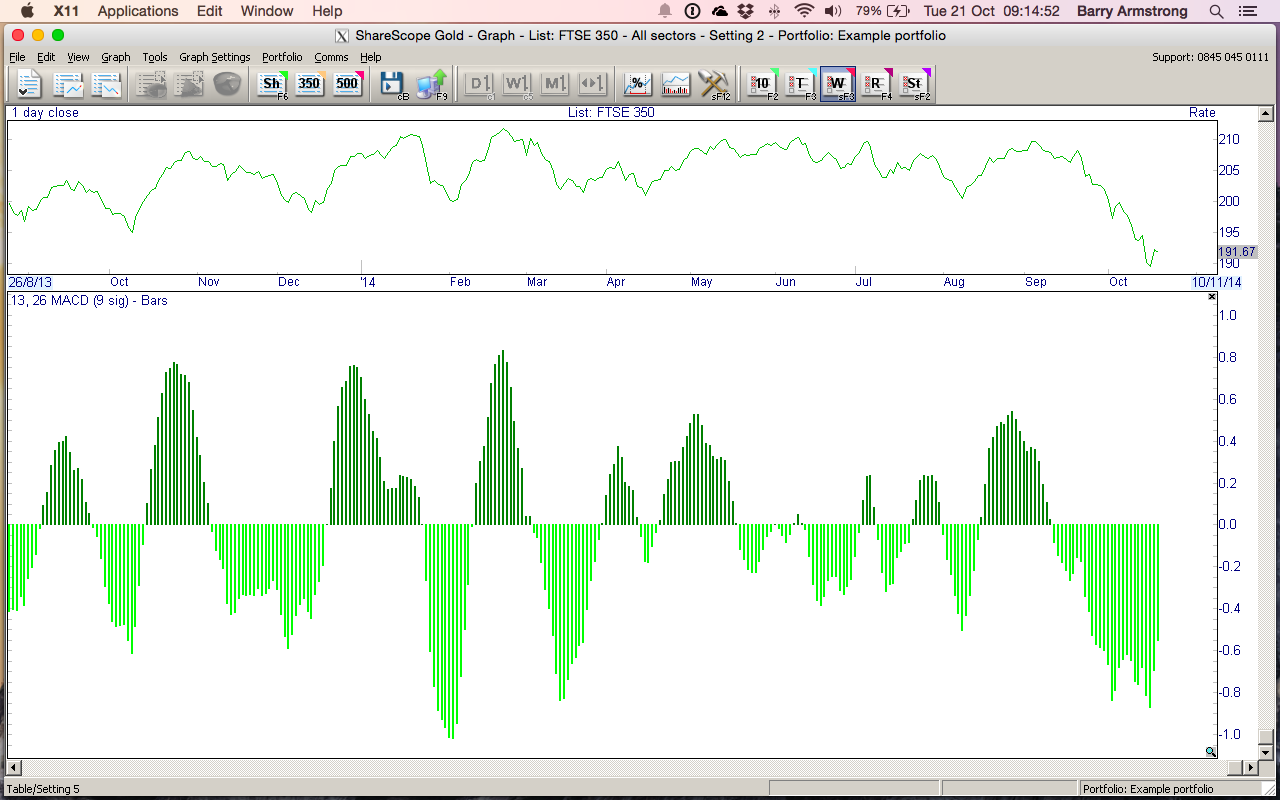
    The Economist have an article this week that asks “prices are high across a range of assets. Is it time to worry?”

    Before the 2007-08 financial crash I managed to cash-in everything that would have been exposed to the crash. This, I’m sure, was luck. I was, at the time, financing a business build; fortuitously, I went much further than cashing-in assets required to support the business.

    Some lost up to 50% of their worth during the 2007-08 crash. (I learnt recently, on their son’s visit to the UK, that this had happened to someone who I had known very well and who now resides in Australia.)

    As the Economist alludes, should we be concerned now?

    I spent nearly a year in the development of fundamental formulae based on Benjamin Graham’s ideas. His method principally determined a ‘margin of safety’. As the Economist article explains: “the price paid for a stock or a bond should allow for human error, bad luck or, indeed, many things going wrong at once”.

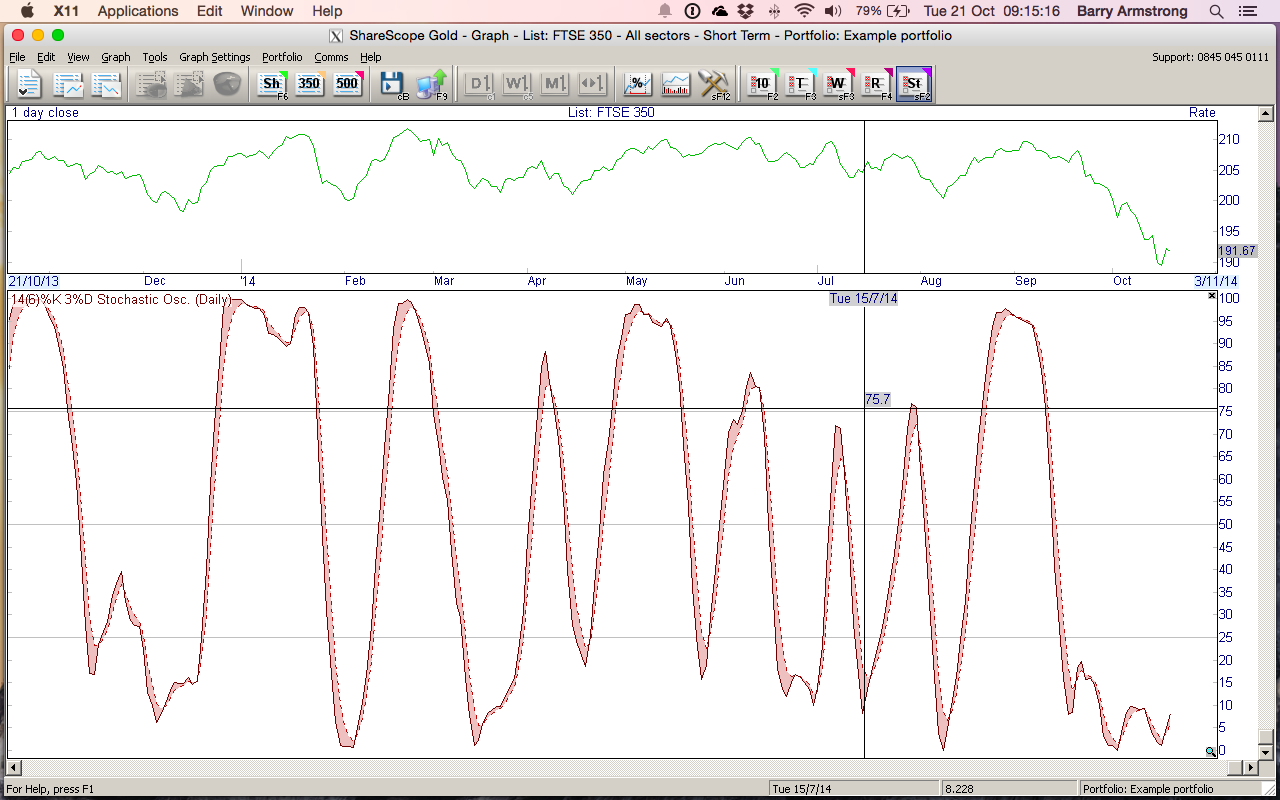
    In my technical trading, which is the only trading I now do, ‘margin of safety’ is everything: (1) I do not carry a trade overnight and certainly not over a weekend. (2) The risk of each trade does not exceed a maximum. (3) I cannot multi task, so I trade only one thing, watch it in the moment and with awareness of what (news) might affect it.

    Not many have the will, the time or the inclination to do what I do. I understand that. So we use traditional fund managers.

    Graham’s ‘margin of safety’ was buying a share at a 50% discount or better. can we get that deal today? If not, fund managers may become increasingly incautious in their dealings.

    Buffett said this week, as reported by the Economist, “stocks would look cheap in three years’ time if interest rates were one percentage point higher, but not if they were three percentage points higher”.

    In the meantime, for my fund investors, I’m very happy to take ‘margin of safety’ into my own hands.

    P.S. My articles are few and far between currently as I work on a strategy e-book and of course my trading.

  • Top ten companies that are selling at a discount – FTSE 350

    On the previous blog, also dated 25th February 2017, Nick has provided the list of companies from the FTSE 350 that made the grade for our long-term investment.

    The spreadsheet was the cumulation of focused effort by Nick and me over a 9-month period a few years back. Nick, spent, subsequently, a considerable amount of time improving the calculation.

    Here’s an example of the back sheet of information that is taken for up to 10 years of figures for each company in the FTSE 350 – and this does not show the mind numbing calculations that are used within each of these boxes.

    screenshot-2017-02-24-11-15-36

    We must emphasise that this is meant for longer term investment. The principles of which use many ideas from the great investors, but primarily that of Benjamin Graham and Warren Buffett – and, if you know these investors, we are talking longer term.

    Nick has only provided FTSE 350 as the information is aimed at UK ISA or SIPP investors.

    Here is a synopsis of the filters of the principal figures used: “and, we have to say, principal figures that cannot be found anywhere else” 

    Margin of Safety: price is less than 60% of value

    Age: more than 4-years trading with less than 2-years of negative earnings

    Growth: a growth rate greater than 10% to ensure a reasonable rate of return

    Consistency: 10% growth rate in all variables – consistency score greater than 60%

    (Blackberry conundrum: consistency of growth improves over time)

    You will notice, in the more detailed sheets below, that annual report dates can be over 12 months old. That is because of the release time of annual report information. Although we are long-term investors with this information, Nick will run the calculations every few months to capture annual result information reasonably early.

    Here is the more detailed, and most up to date annual report information, on each of our companies that made the cut:

    snip20170225_2

    snip20170225_4

    snip20170225_5

    Finally, anyone using this information to invest we must, of course, point you to our disclaimer page. Also, it is important that individuals do their own due diligence. It is important that, as investors, we understand the company we are investing into. The information above is detailed but we must determine for ourselves if we think a company has legs for the longer term.

  • Being conditional helps us win the pub quiz

    With the possible exception of day trading, all trades or investments follow a simple process:

    • Conditional
    • Trend
    • Price

    This applies no matter what my preferred method.

    Conditional is something that gives us a clue as to the probability of something happening in a defined way. In other words, its like taking a sneaky peak at an answer sheet before a pub quiz.

    Conditional can be any number of things. For example, our conditional could be as simple as knowing how popular a product is, or how well somewhere is managed, or we have a particular take on how to calculate a future value of a company, or we might have a particular talent in astrology!

    Whatever it is, we need something conditional to give us an advantage. Without it, with regards to the big picture, we’re guessing.

    I use different conditional guides for different items. For shares and stocks over the shorter term its consistent EPS (earnings per share) percentage growth over the past 10 years. Sounds complicated but is easy to obtain with most trading software.

    For longer term buys its future value, what Benjamin Graham coined Margin of Safety (MOS). I couple the MOS with consistency of growth.  If you’ve seen my early blogs this is difficult to do well. However, you would be daft to trade (invest) long term without it – or something that gives us a similarly advantageous condition. Maybe Nick, the author of the calculations I use, can provide this information on-line in the future.

    Also, a current favourite of mine in the medium term time frame for foreign exchange pairings (FX) and commodities is the COT (commitment of traders) report. A simple chart but one, I have learnt ,through lots of trial and error, that takes many consistent weeks and months to understand properly and use well.

    Ask yourself (or your fund manager) what ‘conditional’ you (fund manager) use. Are you happy with it. Does it work. Or are we guessing?

  • Finding the Trend

    Consistently finding the trend is possibly one of the most difficult things to do when trading.

    One idea is to use a single 260 day moving average. This represents about a year in trading days. If trading long then the lows of the chart for at least a week prior are to be above the 260 day moving average.

    However, only trade long when you have this together with your chosen market as a whole moving long. This is important and the opposite is true if trading short. The figure below shows the current FTSE 350 in MACD histogram weighted by cap. This market is tentatively moving long, i.e. moving into a tentative buy regime. I say tentative because of the shape and depth of the histogram.

    Screenshot 2014-10-21 09.14.55

    Together with the histogram, if trading long, the stochastic, or similar indicator, must show an over sold:

    Screenshot 2014-10-21 09.15.16


    Here are a few shares that currently meet the 260 day moving average criteria:

    Screenshot 2014-10-21 09.16.29

    Screenshot 2014-10-21 09.16.39Screenshot 2014-10-21 09.16.29


    The individual share must also meet the MACD and Stochastic requirements. As an added assurance, the calculated Margin of Safety is to be acceptable, depending on whether you are long or short.

    Happy trading

    B