Top ten companies that are selling at a discount – FTSE 350

On the previous blog, also dated 25th February 2017, Nick has provided the list of companies from the FTSE 350 that made the grade for our long-term investment.

The spreadsheet was the cumulation of focused effort by Nick and me over a 9-month period a few years back. Nick, spent. Subsequently, a considerable amount of time improving the calculation.

Here’s an example of the back sheet of information for up to 10 years of figures for each company in the FTSE 350 – and this does not show the mind-numbing calculations within each of these boxes.

screenshot-2017-02-24-11-15-36

We must emphasise that this is for longer-term investment. The principles of which use many ideas from the famous investors, but primarily that of Benjamin Graham and Warren Buffett – and, if you know these investors, we are talking long term.

Nick has only provided FTSE 350 for UK ISA or SIPP investors.

Here is a synopsis of the filters of the principal figures used: “and, we have to say, principal figures that are nowhere else.” 

The Margin of Safety: price is less than 60% of the value

Age: more than 4-years trading with less than 2-years of negative earnings

Growth: a growth rate higher than 10% to ensure a reasonable rate of return

Consistency: 10% growth rate in all variables – consistency score higher than 60%

(Blackberry conundrum: consistency of growth improves over time)

You will notice, in the more detailed sheets below, that annual report dates can be over 12 months old. That is because of the release time of annual report information. Although we are long-term investors with this information, Nick will run the calculations every few months to capture yearly result information reasonably early.

Here is the more detailed, and most up to date annual report information, on each of our companies that qualified:

snip20170225_2

snip20170225_4

snip20170225_5

Finally, anyone using this information to invest we must, of course, point you to our disclaimer page. Also, it is important that individuals do their due diligence. It is essential that, as investors, we understand the company. The information above is detailed but we must determine for ourselves if we think a company has legs for the longer term.

Which companies make the grade for long-term investment, FTSE 350

Name

Ticker

Sub Sector

Crest Nicholson Holdings Ltd

CRST

Home Construction

B&M European Value Retail SA

BME

Broadline Retailers

ZPG PLC

ZPG

Media Agencies

NewRiver REIT PLC

NRR

Retail REITs

Shire PLC

SHP

Pharmaceuticals

Wizz Air Holding PLC

WIZZ

Airlines

Playtech PLC

PTEC

Gambling

Hikma Pharmaceuticals PLC

HIK

Pharmaceuticals

Micro Focus International PLC

MCRO

Software

Hargreaves Lansdown PLC

HL_

Asset Managers


Long-term buys

For those that can save for 20 to 30 years consider this pension idea. Based on a UK ISA and investing in companies within the FTSE 350.

It’s an idea developed around Benjamin Graham’s (Warren Buffett’s mentor) principles of intrinsic value.

We take 10-years of annual results and determine critical numbers of consistency of growth, growth rate and present value as a percentage projected: i.e. is our chosen company a bargain?

Here’s a snapshot of some figures a few years back.

snip20170107_1

This analysis is for the long view. The figures are a vital starting point but does not take into consideration the longevity of the company nor the ability of those managing the company.

That is why we should only invest in companies that we understand, or are prepared to do the work to gain understanding. For example, Blackberry scored highly on the above figures, right up until it fell off a ‘technological’ cliff.

That means, even with the figures, it is essential that we do our due diligence and are happy that a company has legs.

Similarly, and often subjective, motivation and reimbursement of the individuals responsible for driving a company forward help our decision to buy.

But having said that, thanks to Nick, the hard stuff, the figures, will be provided here soon.

We also intend to provide a ‘price action’ analysis from long-term charts to help with buy decisions.

Finally, those looking for a home for a stocks & shares ISA we thought that Charles Stanley Direct came out well. Their charges are some of the lowest and all seems clear and easy to follow. Unlike many ISA providers, we found.

How to invest

I have written about investments before. But it is worth going over again.

The problem is the medium-term investment area; where most people invest. The near-term to 25-year investment timeframe.

The investment area that works, if done correctly, is following Warren Buffet’s example of investing in undervalued stocks and holding for more than 30 years. Indeed he doesn’t sell.

The other area that works, but is challenging to master, is the very short-term stuff. I cover this every week on this blog.

Okay, we have only two time-frames that we can invest with confidence: the very long and the very short.

Why does the middle investment area not work? Because of market volatility and the probability of a market crash within that time frame.

A market crash for the Warren Buffet model, the very long-term investors, is just a blip in the big scheme of things. Not a problem. In the Buffet model, we go through many crashes and use them as opportunities to add more stocks.

A market crash for the day traders and daily chart readers (like myself) is not usually an issue because the signals of a crash will show on the day and get out stops are very tight for these type of investors. Actually, for these guys, if they’re right, a crash is a big payday. They’re taking it all from the mutual funds.

For the Warren Buffet followers among us, we need excellent fundamental information which we review annually. This information we’ll cover in another blog.

On the other extreme, the short-term investors, day trading and daily chart reading, is not for everyone.

So that leaves us back with what to do about the middle timeframe investing problem.

If we have to be a middle term investor, then avoid the traditional, heavily biased towards stocks, mutual funds.

Observe where the mutual fund invests. Few funds balance investments between cash, stocks, bonds and commodities. Funds that do this, and not being more than 25% invested in stocks, are incredibly steady funds and good medium-term investments.

If we do have to go the mutual route, then costs are a significant factor. For every 1% that we pay a mutual fund will result in 20% of the fund managers over the medium time frame. Look for a cost of around 0.5%, no more. Same goes for pension funds.

The majority of mutual funds, however, invest more heavily in stocks and most don’t beat the index. These mutual funds are in the danger zone. When a stock crash happens the fund profit, and much of the capital is wiped out. Allow several years to get back to neutral. Not a lot of fun.

So, if we have to invest in the middle term investments then look for: a fund (mutual and pension) that has low fund costs; and an investment portfolio that balances bonds, cash, commodities and stocks – and is unusually light on stocks.

Price action or fundamentals

As previously mentioned, I’m focused on trading 5-minute charts EUR USD. To master price action trading, and with a low time chart such as the 5 minute, takes all my undistracted concentration. I think that, most, professional traders use price action. Some may voice that they also use fundamentals and specific indicators, but when it comes down to the profits it’s usually price action, in some form, that’s responsible.

My trades on the 5 minute charts last from a few minutes to usually no more than an hour. Therefore, fundamentals have no influence. Although some traders consider fundamentals, they are the ‘go to’ consideration of the investor rather than the trader. An investor is committed longer-term, a duration where the fundamentals have time to take effect – many months to years. I studied fundamentals for several years. However, I now feel that even the highest term charts, such as weekly’s or monthly’s, are (primarily) influenced by price action and therefore ‘technical’ rather than ‘fundamental’ reasons. That is because price action is a measure of psychology in the market – such as fear, greed and confidence.

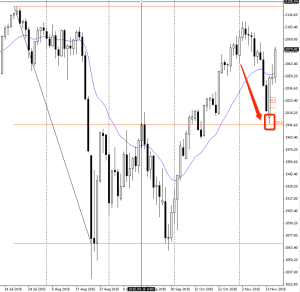
Notice below how the recent attacks in France affected the S&P 500. Notice also that the drop, before the S&P’s quick recovery, bounced off a 50% retrace line. A line that I had drawn on the chart several weeks ago; this is a part of price action, the context, and is known as a measured move. Often this measured move is exact – whether it’s a 5-minute chart or a daily chart like the one below. The news (France) moved the market, but price action told it where to go too.

Snip20151118_22

Slow Trader Diary – week 32

No trades cashed-in this week.

We also had no costs against us.

This week we entered Pace PLC and DTE Energy Co, both on a December quarterly trade.

We are mostly short-term swing traders: so are our trades taken as DFB (Daily Fund Bets) or quarterly futures trades?

The DFB gives us a tight spread (the difference between the buy and the selling price) but has a daily interest cost. A quarterly futures bet (near, mid or far quarter) has a more substantial spread the more distant the quarter but carries no interest charge. So which one to take – a DFB or a future quarterly – depends on time. In other words, it depends on the duration we think we will hold the trade.

DFB is a suitable means to trade currency pairs (FX). With shares and stocks, however, we have the option of a DFB or a quarterly futures trade; I will look to take a mid-quarterly trade where possible.

Here is our trade with DTE Energy Co:

Snip20150808_13


DTE Energy is conventional electricity. Our conditional is ten years of positive earnings per share (EPS) percentage growth. As for recent trend, the stock is trending up which we can see from higher highs and higher lows. The 21-day moving average supports this. Our price, for us in this example, as there are many personal ways of determining price, is the confluence of a support line (a 61.8% Fibonacci retracement line to be exact) and the pin bar the day before. We took the trade on-limit, which meant the price did come down to a more favourable rate before we bought automatically. We have set a target limit of 90.67. That gives us a risk reward of nearly four times.

Here is our trade with Pace PLC:

Snip20150808_14

Pace PLC is telecommunications equipment. This trade has gone against us slightly, and I’m not happy with my decision to take this trade. Our conditional, again, is ten years of positive EPS percentage growth. However, it is the trend that is our weak link. Over the last 18 months, except for a large gap up, the trend is down; this is made more so with the drop in price yesterday. A closer look at the recent trend confirms this. Our price, a confluence of a support level and price action is okay but is secondary to the trend. Also, our price action, being the pin, in hindsight, is black where a white pin would have been preferable. I will tighten our stop to minimise any loss and if we get a rebound, I will sell early at, or close to, break-even price.

No buy or short signals in FX this week. FX requires a regular watch so as not to miss the opportunities. By regular I mean a once daily detailed review of daily bars. Because of the timing of the FX New York close daily bars, at  9pm or 10 pm, depending on UK/US time difference; or, as is my preference, early, before 7 am, UK time. Then a look every 4 hours where possible, to match the 4-hour bar close times. However, I find that as we get closer to a buy or short opportunity the best way is to set an automatic (ambitious) entry.

Being conditional helps us win the pub quiz

With the possible exception of day trading, all trades or investments follow a simple process:

  • Conditional
  • Trend
  • Price

The above applies no matter what my preferred method.

Conditional is something that gives us a clue as to the probability of something happening in a defined way. In other words, it’s like taking a sneak peek at an answer sheet before a pub quiz.

Conditional can be any number of things. For example, our conditional could be as simple as knowing how popular a product is, or how well somewhere is managed, or we have a particular take on how to calculate the future value of a company, or we might have a specific talent in astrology!

Whatever it is, we need something conditional to give us an advantage. Without it, with regards to the big picture, we’re guessing.

I use different conditional guides for various items. For shares and stocks over the shorter term its consistent EPS (earnings per share) percentage growth over the past ten years. Sounds complicated but is easy to obtain with most trading software.

For longer-term buys its future value, what Benjamin Graham coined Margin of Safety (MOS). I couple the MOS with the consistency of growth.  If you’ve seen my first blogs, this is difficult to do well. However, you would be daft to trade (invest) long term without it – or something that gives us a similarly favourable condition. Maybe Nick, the author of the calculations I use, can provide this information online in the future.

Also, a current favourite of mine in the medium term time frame for foreign exchange pairings (FX) and commodities is the COT (commitment of traders) report. A simple chart but one, I have learnt, through lots of trial and error, that takes many consistent weeks and months to understand correctly and use well.

Ask yourself (or your fund manager) what ‘conditional’ you (fund manager) use. Are you happy with it? Does it work? Or are we guessing?

Slow Trader Diary – week 30

Remember from the last diary that we had missed the swing up (hesitancy over Greece) and that we would not take further trades until the swing was right.

You will also recall that we showed the S&P 500, and broadly where it would drop. Here is the S&P today.

Snip20150726_1

We are not sure as yet how far the S&P will drop. However, we can now look for excellent buy opportunities in the S&P and FTSE companies.

It is, of course, not the case that when an index falls (the S&P above is an index) that each company share associated with the index will fall. But in this case, it was a right decision to wait.

To do otherwise reminds me of the comment “the operation went brilliantly, up until the moment the patient died”. The same is true of trading. How well the trade is going – or how many points up or down –  counts for little until a deal is concluded (sold).

Slow Trader Diary – week 29

An early diary entry as I’m going away for a few days to where there is no internet and probably no mobile signal.

Let’s take a look at short-term swings.

Snip20150715_5

We mentioned Alexion Pharmaceuticals in the last blog. The green arrow represents the buy point; this is because the share price has pulled back, in this case to a 50% retrace of a previous move, and provided a buy signal – the pinpointing down is a definite buy signal.

The red arrow represents my sell point. The horizontal lines are drawn using the Fibonacci retracement tool provided with most software, drawn weeks before; this does not mean we can look into the future with share price, but if certain things happen it does give us an advantage in determining probability.

The catch is if you miss the move – which I did being too concerned about Greece – then signals allow you to get into the swing once it has started. But another concern is the index, in this case the S&P 500 index.

Snip20150715_7

The index is of course an average price of all the stocks within the index. Some shares being much more significant than others means that the price change to individual stocks is not well defined, but it’s a handy guide. If the index goes up, by definition, many of the shares go up – and vice versa.

There is a reasonable probability that the S&P index will bounce down when the price reaches somewhere within the red box. Not long, therefore. So to take a buy now from one of our stocks would be the wrong time for a short-term swing trader. Or any trader. Better to be patient and wait for the index to swing back down again and provide a more profitable entry point.

I don’t use the index as a buy/sell signal; the individual stocks do that for us. Price swings are a factor in all charts to some extent: be it stocks, shares, FX or commodities. Reading those swings is the art.